My colleague Jake recently wrote about Disaster Recovery Monitoring, and about how our Incident Response System, using IPFIX/NetFlow is more helpful then tools that rely on SNMP. We at Plixer recently ran into an issue with our Microsoft Exchange Server that helps illustrate the benefit of using IPFIX/NetFlow as an analytic and investigative tool.
A month or so ago, our team started getting reports of slowness in email delivery and network usage in general. The issue was escalated to our system administrator Paul. He found that email was taking twenty minutes to a half-hour to get through, and that there were DNS and user authentication issues on the network. Paul logged into the Exchange server to see what was up. Logging in was painfully slow and almost unusable for troubleshooting, the server was running at 100% CPU.
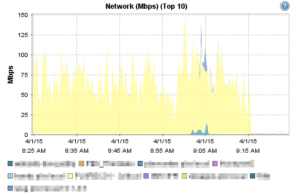
To find out what was causing the problem, Paul logged into the VMware vCenter for the ESXi host the Exchange Server is located on and looked at resource usage. The graph showed that the Exchange Server (in yellow below) had much higher network utilization than expected.

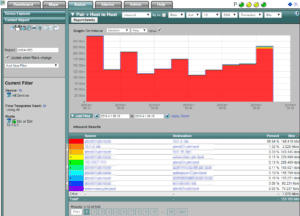
Now that he knew network utilization was the apparent problem, Paul went straight to our incident response system to find out the who, what, and where of the traffic. In the screenshot below, Paul has filtered on the IP address of the Exchange Server. The graph showed immediately that 96% of the network utilization was from the Exchange server to the backup server. The backup server was running during business hours and impeding all the other traffic.
After stopping the backup, network and CPU utilization fell down to acceptable levels and the data logjam was eliminated.

It’s hard to say how long it would have taken Paul to resolve the issue without access to a good IPFIX/NetFlow collection, monitoring and analysis tool. It would have been a struggle, at best, to get a Wireshark packet capture running on a server that was already at 100% CPU. Without our incident response system, Paul would have had to stop mail services, in order to free up enough CPU cycles to get Wireshark up and running. Additional time would have been consumed waiting for the pcap to finish, and still more time while analyzing it when done. All that mail server down time would have created a cascade of bounced or deleted messages and a flood of help-desk queries from senders and recipients wondering where their email was, all of which would have had a big negative impact on productivity for the day.
Mailinizer
As Paul was describing the email incident to me, he reminded me of another great resource in the arsenal of tools that make up our NetFlow/IPFIX traffic analyzer. Mailinizer is an email reporting solution that can be used to obtain useful details about all of the email traffic on the mail server. As an Exchange monitoring tool, it can provide fine grained analytics, including source address, destination address and volume. With proper filtering, mail admins can track the highest volume senders and receivers, popular email subjects and domains.
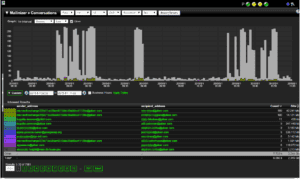
For example, in the screen shot below, Mailinizer is providing details of the conversations from the top ten sending domains and their recipients, and an overall graphic view of email traffic for the morning hours.

The level of detail available allows for the creation of email alerts triggered when various thresholds are met, such as unacceptable volume from social networking sites, or abnormally high volume from any sender.
If you need an Incident Response System that’s capable of resolving internal performance issues and monitoring your Exchange server, as well as detecting cyber threats, we have the solution for you.

