With the growing number of vendors supporting Flow based technologies, we’re seeing a rise in use cases and possibilities for flow analysis and performance monitoring. Even though there has been exponential growth in flow reporting over the last few years, we in the industry are always left with questions, what are we missing? Where can we gather more information? Are we really getting 100% visibility into our network traffic? The answer here is simple, there’s always room to grow!
One area in which flow exports have been missing, is in our virtual environments. We know we can capture our traffic on our physical hardware. When an end user reaches across the internet to load content from a webpage, we can meter this traffic at each hop. We see the traffic as it hits the switch, router and then the firewall. This is all incredibly valuable information, but what about our Virtual Machines? Currently, getting visibility into the communications that never leave our virtual environments is limited. Fortunately, companies are starting to close that gap! VMWare, for example, now has support for exporting IPFIX elements from a Virtual Distributed Switch. This is a huge advancement! Let’s take a look at what their exports have to offer.
VDS
VMware has their Virtual Distributed Switch. VMware’s VDS can exist on multiple ESX hosts and can be configured to export IPFIX. Prior to having IPFIX available in our virtual environments, our visibility was extremely limited. We were able to see the traffic volume coming to or from our server/cluster but what about which VM received the most traffic? Better yet, if we have our VMs hosting single applications, we can see which application is receiving the most traffic. Let’s take a look at how this looks in a report:
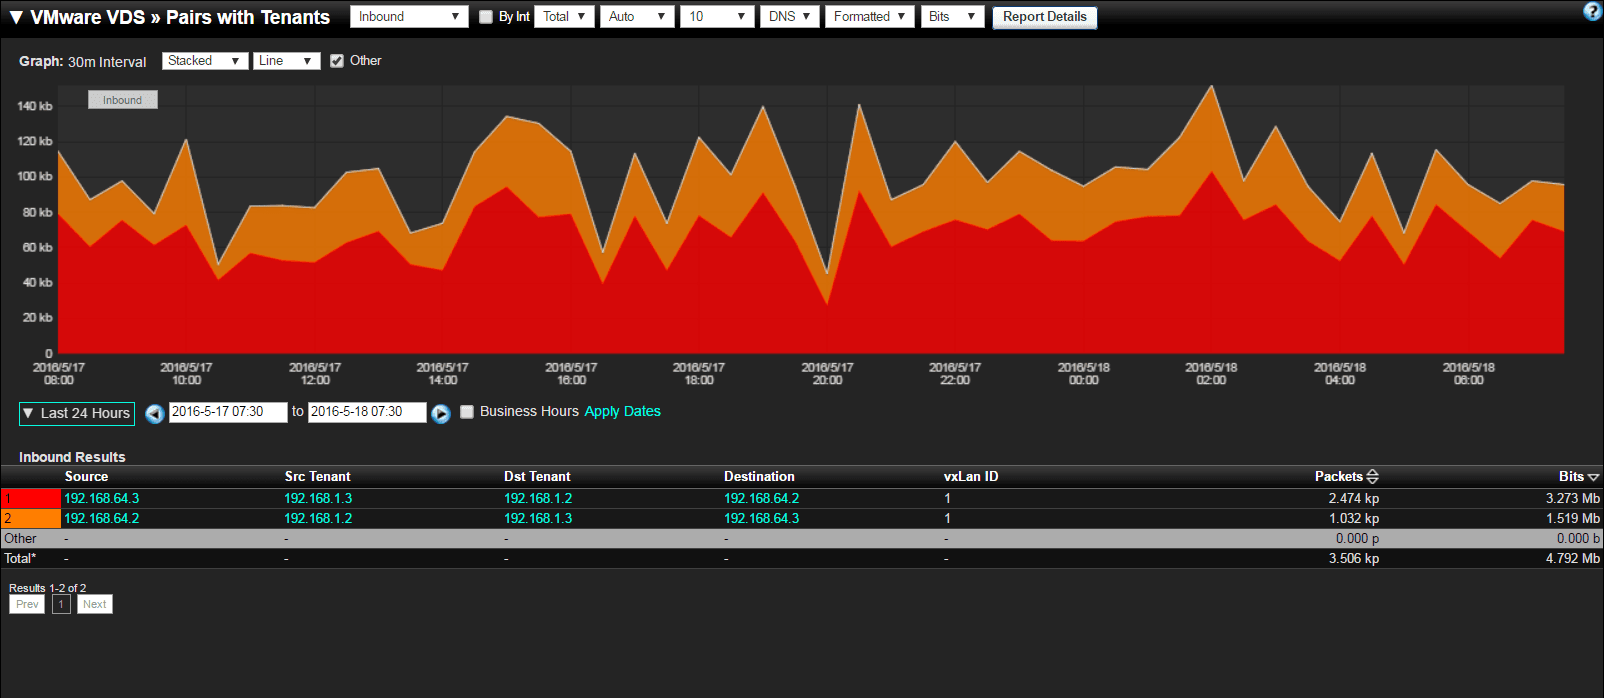
As you can see in the report, the source and destination column represent the IP of each host machine and the Src Tenant and Dst Tenant represent the VMs. Now, not only are we getting information about how much traffic each host machine receives, but it’s specific to the traffic volume to or from each VM. That’s awesome information! If I know we only host our CRM on the tenant 192.168.1.2 I can see that in this time frame we had 3.273 Mb of traffic to that specific application. As useful as this is for bandwidth accounting, I’d also like to know what type of conversations are taking place, fortunately we can see that as well!
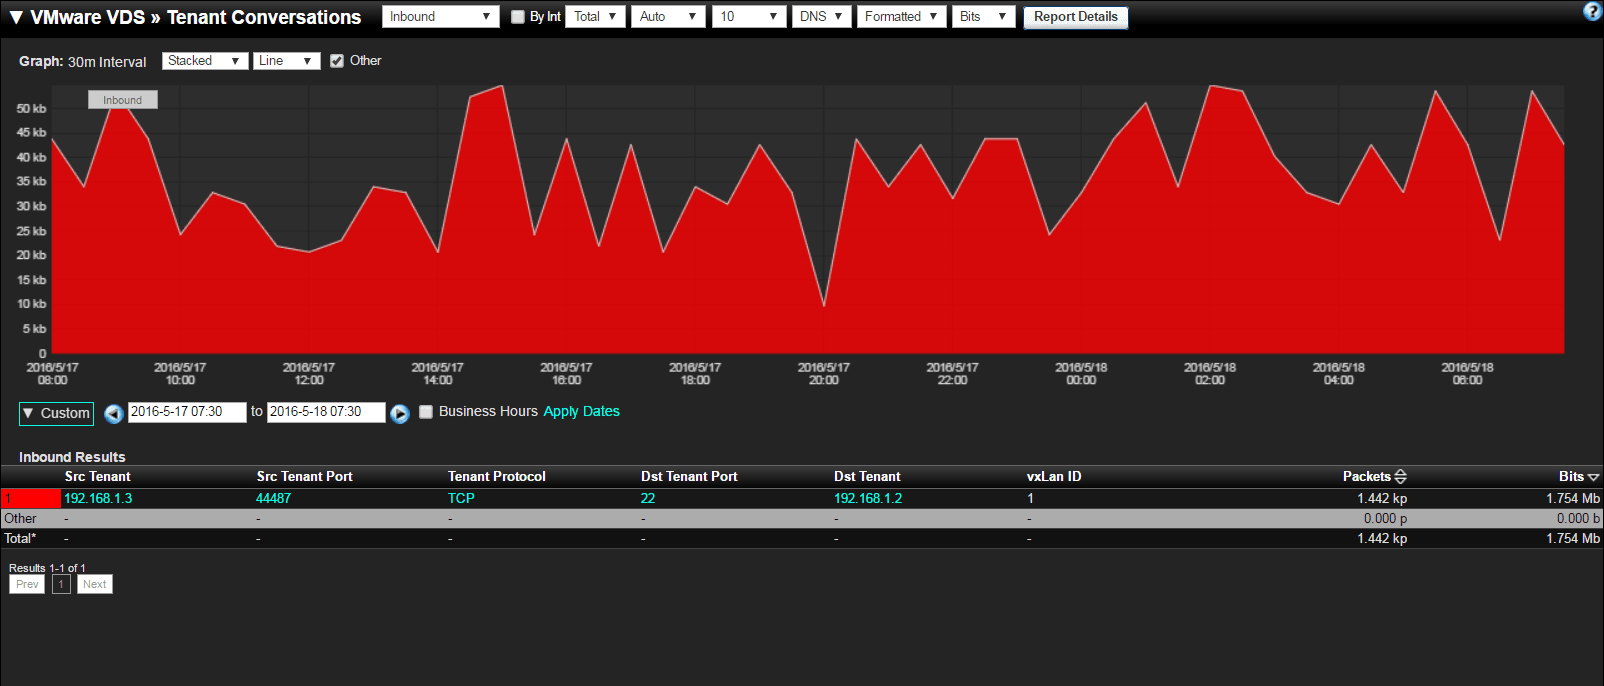
In this report we’re filtered on a specific conversation as an example. We now have the added elements of Src Tenant Port, Tenant Protocol and Dst Tenant Protocol from within the encapsulated packet. In this example it looks as though we have a SSH session from one tenant to the other. Let’s pivot and take a look at all of the elements that can be exported as IPFIX:
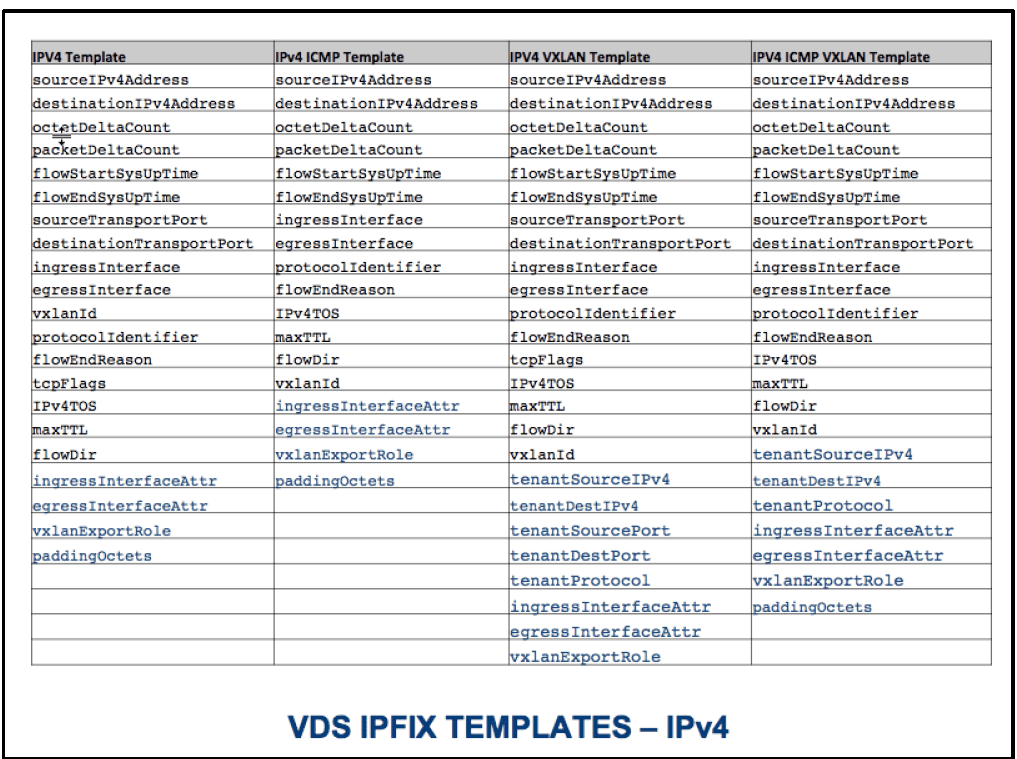
As you can see there is a lot of useful information to be gained with VMware’s IPFIX exports. With more and more companies moving to virtual environments (not just servers but end user machines!) having visibility inside these virtual environments can be invaluable!
The valuable information doesn’t just stop with the VDS, VMware is also exporting IPFIX from their Distributed Firewall. For more information view this blog by Alienor!
For more information about configuring your VDS to export IPFIX head over to this blog by Scott R.!