When thinking about extracting maximum value from network metadata such as Netflow, IPFIX, SFlow, etc., data enrichment becomes extremely important.
Have you ever been asked, “How much traffic is O365 utilizing?”
Although this blog will focus on Microsoft, you can swap out the application for whatever you want. The point I’m trying to make is, the “cloud first” movement isn’t going anywhere, and there is some low hanging fruit available to engineers to help visualize which apps are running on the wide area network.
Vanilla metadata, NetFlow v5 for example, restricts visualizations to Layer 3 address space and Layer 4 transport. These limitations are something that vendors have already started to solve for by evolving to more feature-rich variants of metadata like IPFIX or Flexible Netflow. A strategy adopted by vendors like Palo Alto, Cisco, and others, is to include an application ID in the metadata exports. This App ID can be used to correlate traffic to a more meaningful identifier.
To quickly highlight what these technologies can offer, let’s take a look at the exact same data, from the same device (a Palo Alto Firewall) in two different ways.
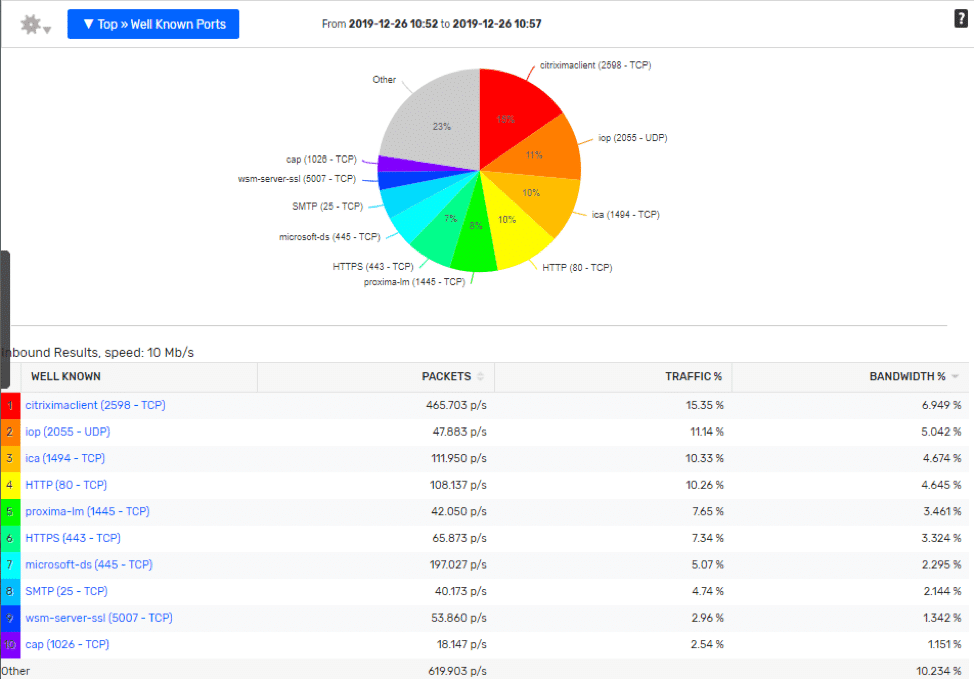
Layer 4 Transports:
As a network engineer, I may know that port 2055 is commonly used to transport NetFlow, and may be able to figure out what most of the other traffic is if I examined the IP ranges and did some Googling, but this is going to be tedious, eat up cycles in the day, and is really just an unnecessary struggle.
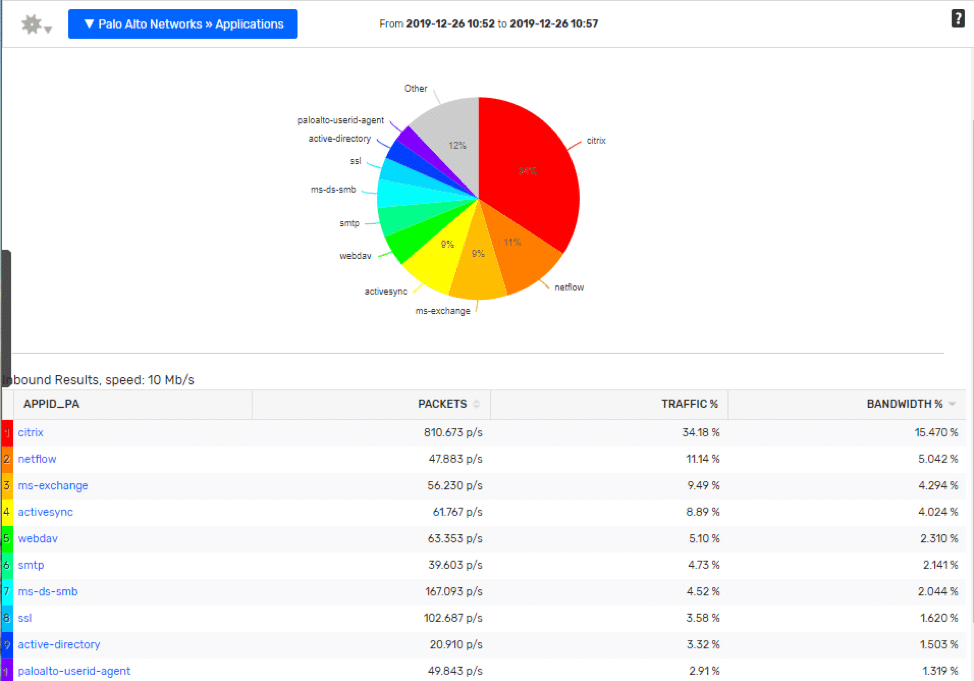
Palo Alto Application ID:
Notice in the report below, most of the Layer 4 ports have been swapped out with a logical application name. The legwork is done for you at the device level, what I like best about enriched flow data is the ability it gives the engineers to:
- Make these reports more relatable for everyone in an organization.
- Reduce mean time to know when trying to identify what application may be causing a problem.
- Help with capacity planning initiatives by having better groupings of the data.
Was this blog clickbait?
Ok, ok, ok… the title of the blog was about monitoring Microsoft traffic, and I’m blabbing on about Palo Alto, and the history of flow data. Fear not, answers are coming—I wanted to include a little history for you to share with friends during the holiday season.
So, although features like NBAR and PanOS App ID are really cool, it does require that you have a certain networking vendor, and in many cases, you may need to push out configuration changes to your devices to enable the features.
Utilizing the IP Groups feature in Scrutinizer, along with a little Python magic we could harvest some really low hanging fruit as an alternative method for identifying cloud applications.
Taking a look at the data provided by Microsoft we can see it has everything needed to start naming this traffic within Scrutinizer.
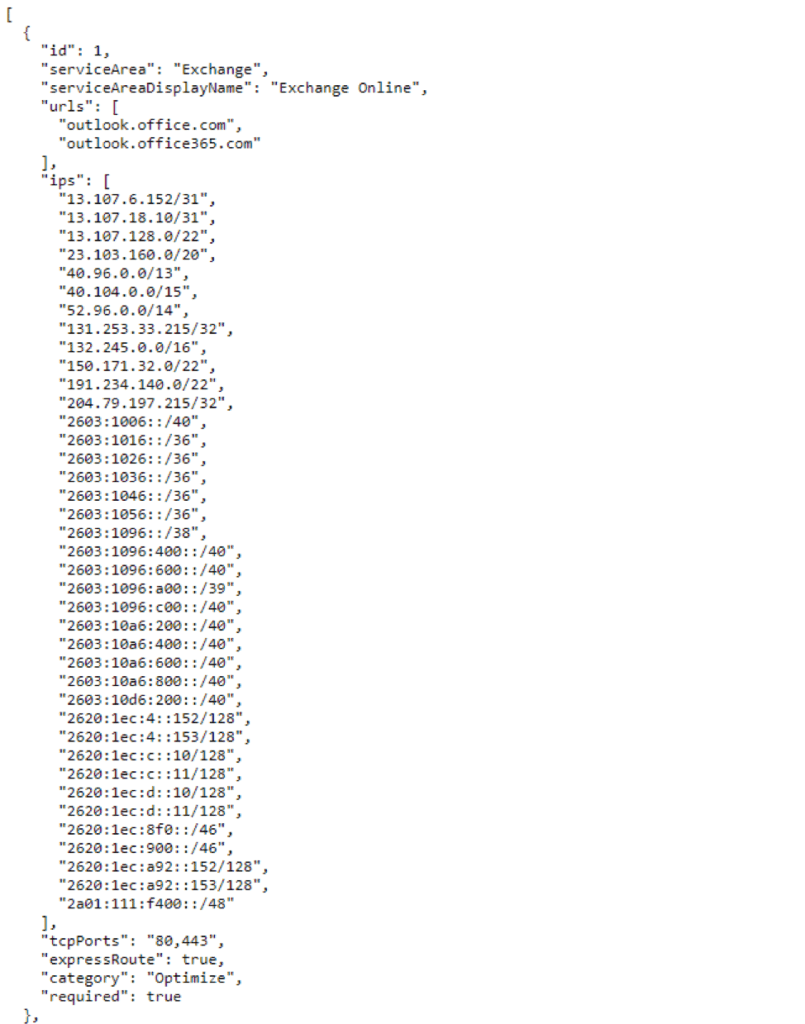
I took the liberty of putting together a quick script that utilizes this data and creates groups utilizing the Scrutinizer API. Although I find these IPs to be pretty static, it can be a good idea to set up a CRON task in order to run the script at some interval to make sure everything stays up to date. Like before we can look at some side to side comparisons to see how this simple data enrichment makes can make interpreting the reports a lot easier.
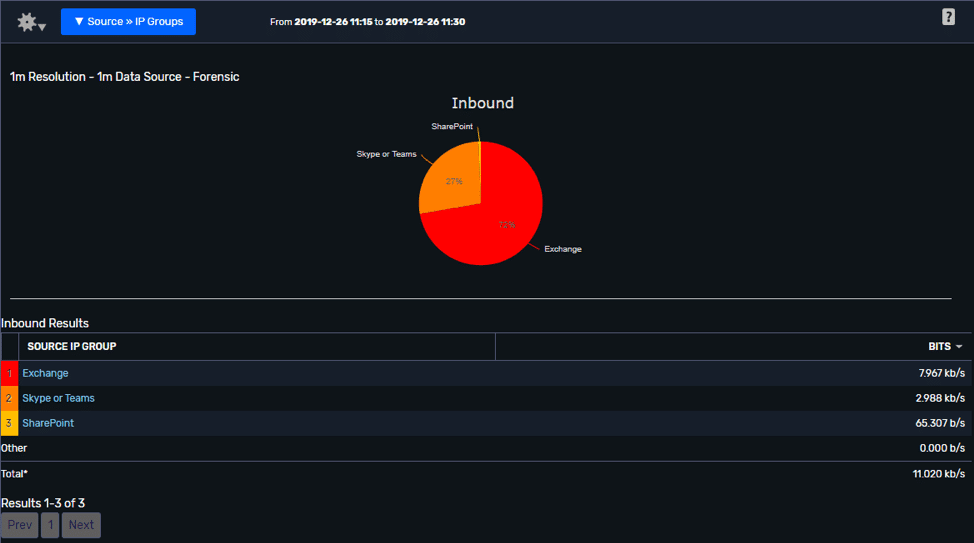
Data viewed using IP Groups:
A report like this makes it a lot easier to predict or analyze the impact a transition to Office 365 might be having at a remote site.
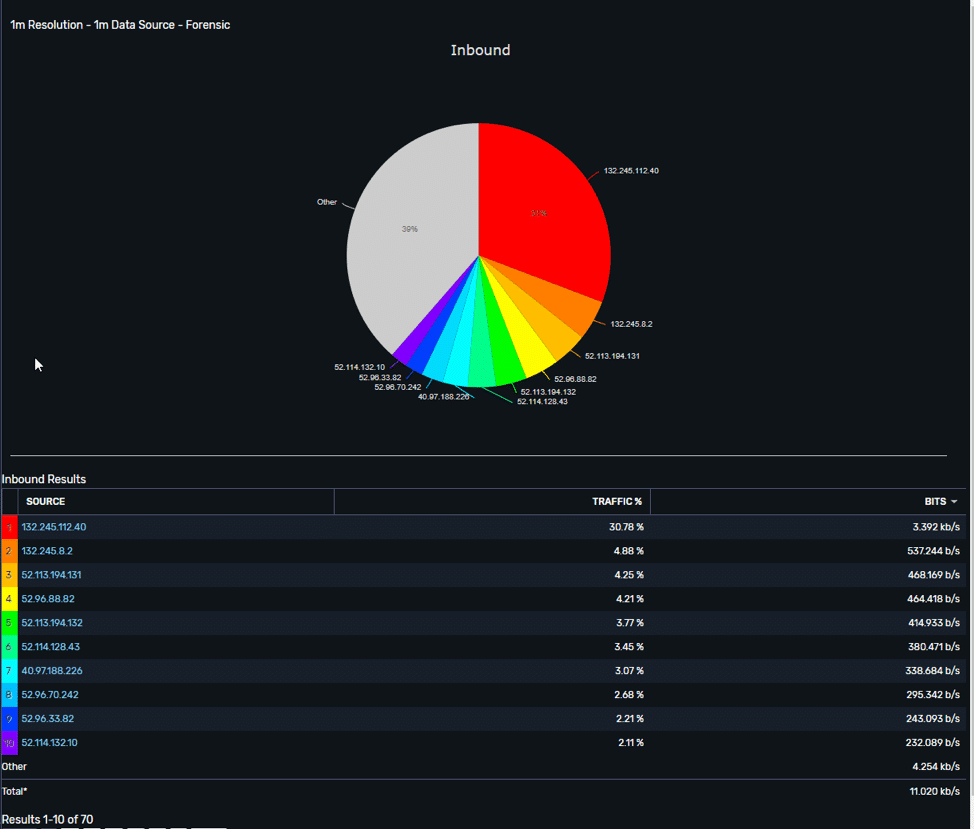
Data Viewed by IP Address:
Switching the report to only showing IP Addresses, lets us see that we have consolidated 70 unique hots into three perspective groups, which provides a much better report to put up on a dashboard or include in a project right up.
I think it’s important to note that using the IP Grouping feature in Scrutinizer will only bind the traffic to the addresses. In another version of the script, I may elect to use the ports provided by Microsoft and use the Defined Application feature to narrow the focus even further. For now, users could add a port 80 or 443 filter to further narrow the scope of the report if they want.
The IP groups feature in Scrutinizer is one of my favorites. It allows for cool visualizations of how networks interact with each other and can be a powerful resource to help you maximize the many benefits of collecting network metadata.
If you would like any help in setting up this script, or IP Groups in general—please don’t hesitate to reach out to me directly!