In my last post, titled Network Visibility: Using Dashboards to Tell a Deeper Story, we discussed how the dashboard feature of Scrutinizer can be an asset to multiple departments. I’ve had the opportunity to work with clients who had a one- or two-person shop and some who had multiple departments. There has been one common thing across all these deployments: by employing the features of the dashboard engine, they were able to reduce the time it takes to find what they are looking for. In this section, we will explore the network security department.
As you already know, Scrutinizer is built on a strong foundation of data. The ability to collect conversation metadata from multiple sources and correlate those conversations gives you visibility that you didn’t have before. With the conversation records, we can see what a conversation consisted of and save it historically.
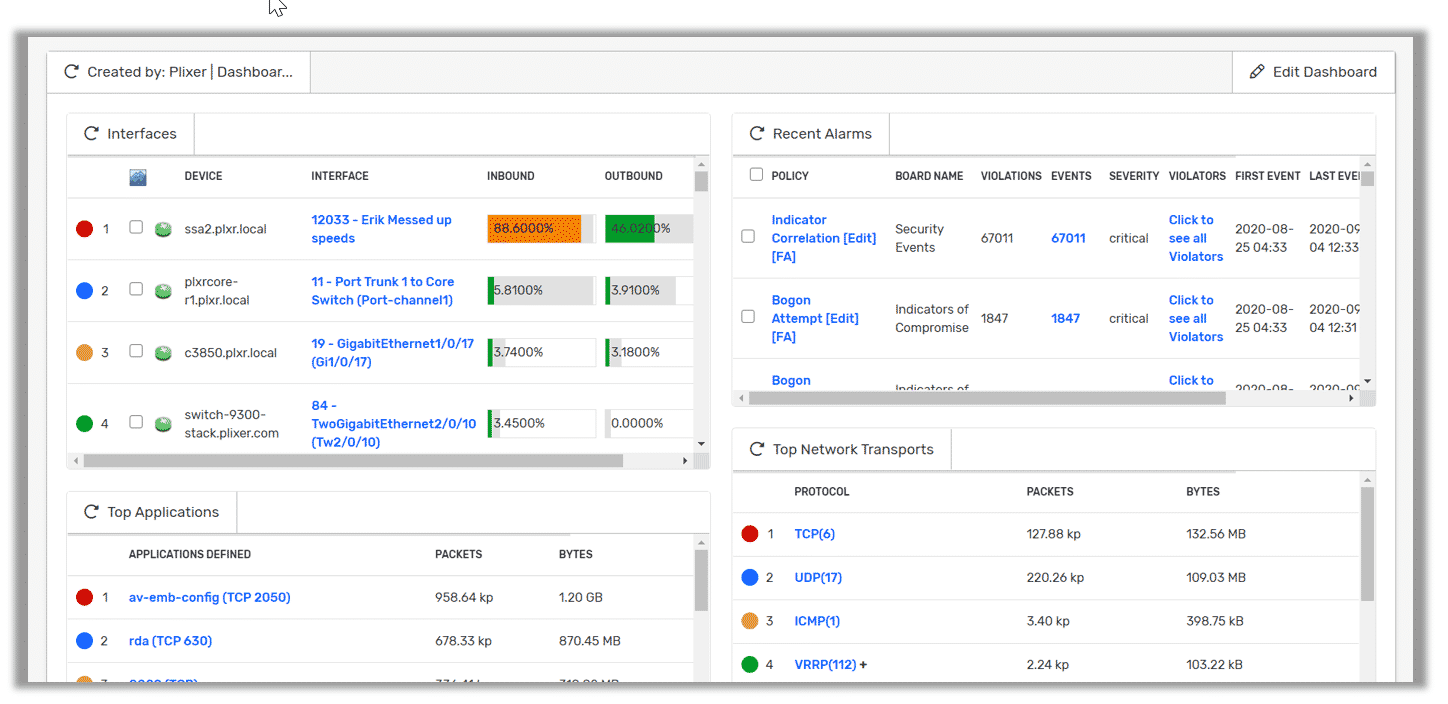
Default Network Security View
Scrutinizer employs an army of intelligent algorithms called Flow Analytics. Their job is to help provide advanced security analytics of your flow data. They do this by going through your conversation data and looking for traffic patterns that resemble malicious activity.

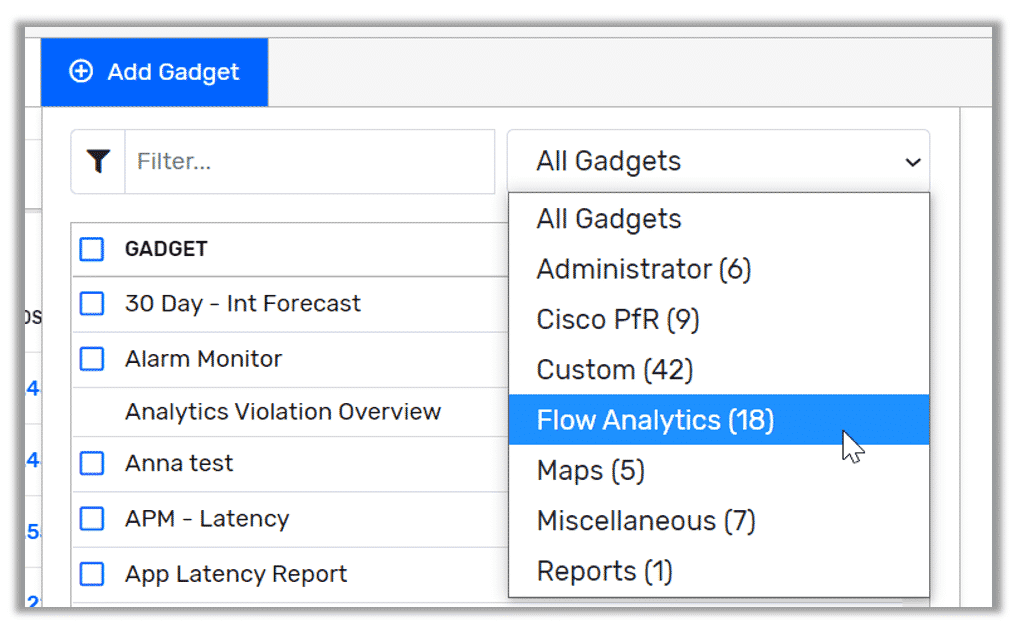
Out of the box, Scrutinizer comes with 23 that not only help you monitor incident activity, but also the conversations surrounding that incident. For example, these gadgets can help give you a better picture of the policies that have been violated, the number of incidents associated with that policy, and the ability to dig down into the incident and see the conversations associated.
Digging Deeper
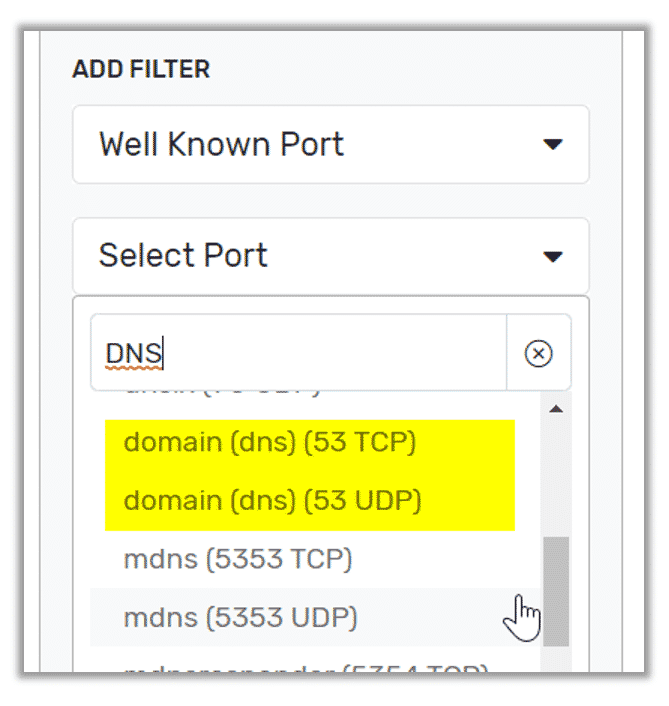
The real power of our dashboard engine is the ability to turn any Scrutinizer report into a gadget. For a security team, having one go-to place that has the reports they need decreases the time to resolution significantly. One example that I like to see on a security dashboard is a Rogue DNS Report. By creating a quick report and saving to your dashboard, it:
- Filters for DNS Traffic
- Excludes your DNS servers
- Has a threshold of one so you are alerted if someone is attempting to use a non-authorized DNS

You now have not only built a traffic-specific monitoring tool, but have also added it to your dashboard for easier investigation.
One last example that I tend to talk about is the concept of compartmentalizing data. As a matter of fact, TechRepublic just said that supply chain security is a lost cause and “Compartmentalizing access to data and fingerprinting data shared with third parties to detect leaks will be increasingly important strategies as once-trusted third parties require more scrutiny.” Here I tend to create a report that puts the segmented networks in the IP groups. The goal of this report is to show me the conversations between the groups. From the security side, you might have set things up so these groups don’t talk to each other. If this is the case, your report would be blank.
I know, a blank report doesn’t seem all that valuable. But if you add a threshold to this report and then save it to your dashboard, you now have an easy-to-get-to tool when an issue does occur. You have built a monitoring tool that is specific to your network.
There are a lot of ways a security team can enhance their ability to act on a threat with Scrutinizer’s dashboard engine. If one of your requirements is improving your network monitoring posture and gaining deeper visibility, but you don’t know where to start, why not evaluate Scrutinizer?


