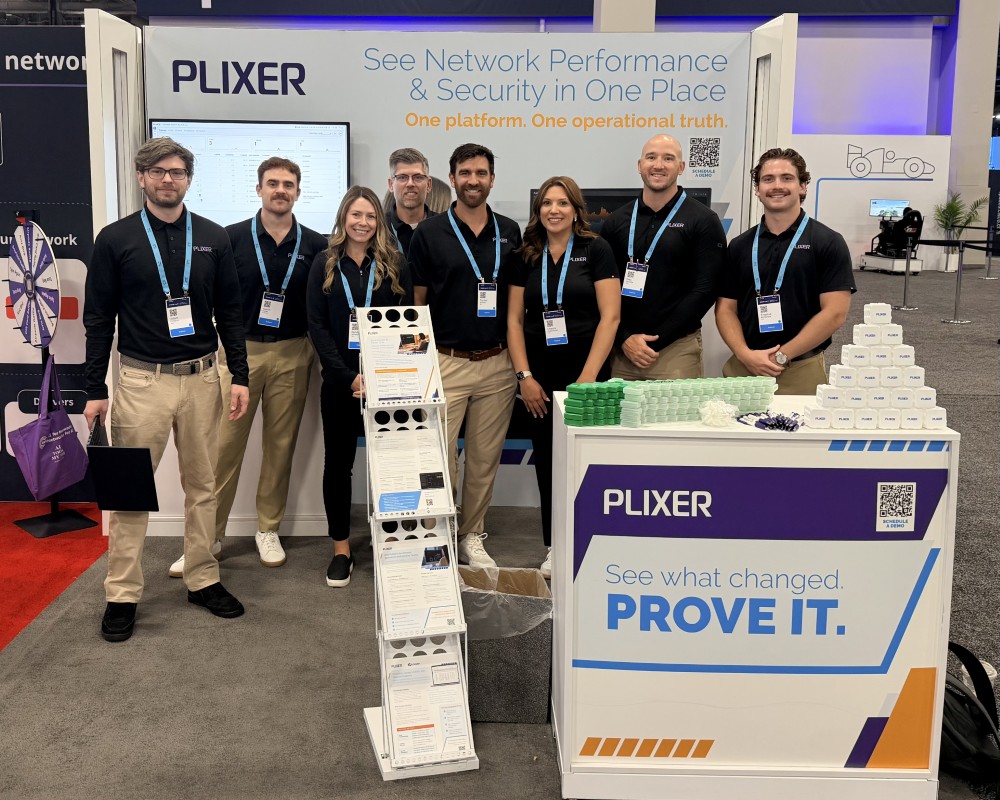
Blog :: Network Operations

Network Problem Solving Use Cases

In the last year I’ve been fortunate enough to be a Field Engineer for a company that I love. I’ve had the incredible opportunity to fly around the world deploying our technology into a variety of infrastructures, travelling to some amazing places, enjoying a range of different foods and cultures, and meeting some extraordinary engineers and technicians along the way. While no two trips will ever be the same, they do share one commonality: the satisfaction of instant results upon deployment. In this blog, I’d like to share a few of my experiences.

When deploying our technology in a new environment, it’s hard not to anticipate what we’ll uncover. Of course I never want to find an issue, but when we can uncover a network problem almost instantaneously, there is no better feeling. Not only do we isolate a longstanding issue in minutes, but in most cases we can go from “network problem solving” to “network problem solved” in nearly the same amount of time.

A Timely Issue

monitoring your international traffic

Not every issue we encounter is as severe as the next. For example, the most common issues I come across are simple misconfigurations. On a recent trip, I was working with a great team of Network Engineers and the morning was going as expected. Our appliances were racked, configured in a distributed cluster, IP’d, and powered on. Once we configured the array of networking devices to start exporting flows, it was time to analyze.

This particular company had used an alternate NetFlow collector in the past, but it wasn’t as robust or in-depth a solution as Scrutinizer. Needless to say, they were as excited as I to start digging into their traffic. We began very high-level; using our built-in dashboard gadgets, we checked what the top traffic was. There was nothing surprising; top port/protocol wasn’t alarming, essentially what you would expect (HTTP/HTTPS, DNS, SQL, NFS, etc.).

When it came to top countries, however, we uncovered a head scratcher. This particular company is based in the US, with no real international ties. But the top destination countries were mainly European nations. This raised a few questions for the Network team—time to dig in and find what type of traffic they were sending to all of those European countries. A few clicks later, we were able to drill in using our “Pair > Hosts with Country” report and find all of the internal hosts that were reaching out to the European addresses. A little more concerning was that the source addresses reaching out internationally weren’t end user machines; they were servers from the data center.

We added a filter for the subnet of these servers and pivoted to a “Pair > Conversations Well Known Port” report to find out what port and protocol were in use. Thankfully, this relieved a few concerns; by pivoting our report type, we could see that the internal servers were only sending NTP requests to these European nations. A quick use of our integrated Cisco IronPort also told us that these external addresses were European NTP pools. Within 15 minutes, we were able to recognize an anomaly, isolate the machines involved, and find the root cause, as well as solve an outstanding network problem.

While this example was a simple misconfiguration, it illustrates the immediate impact Scrutinizer can have on your network.

Wireless Headaches

Network problem solving wireless connectivity

A similar experience I had in regard to isolating and resolving network performance impact involved investigating corporate wireless traffic. The network team had been receiving ongoing complaints about wireless connectivity, but they weren’t able to isolate the actual issue. Users were successfully connecting to the Wireless Access Points (WAPs), but would experience intermittent connectivity. Luckily, the infrastructure used a number of Cisco WLCs that export IPFIX. By analyzing the flow data, we were able to isolate each Access Point (AP) and confirm the one in the area of the building the produced the most complaints was dropping clients intermittently. The Network team already had an idea of where and what the problem was, but Scrutinizer was able to provide a visual representation coupled with a packet capture to open a TAC case with Cisco and find resolution.

While investigating the wireless traffic on this particular network, we were puzzled by the amount of traffic traversing one AP. We found a particular host that was transferring over 400GB of traffic daily. Seeing that much traffic going across wireless was cause enough to investigate. First, we isolated the client involved, and were surprised to find it was a conference room PC. We then ran another “Pair > Conversations Well Known Port” report for more contextual details and learned that this was a file transfer to one of their backup servers. Again, we quickly isolated an anomaly, found the root cause, and moved to solving a network problem. Fortunately, in this case, all of the data was being transferred outside of business hours and there wasn’t any productivity impact. A short talk with the Server team, and the anomaly was resolved.

Quick, Into the Sandbox!

Montiroing NXDomain requests

Now we’ve seen a few innocuous examples where Scrutinizer was able to provide immediate results, but not every case is a simple misconfiguration, hardware issue, or user problem. In this example, we were deploying not only a distributed Scrutinizer instance, but a FlowPro Defender as well. For those who aren’t aware, our FlowPro Defender is a network probe that generates IPFIX and performs DPI for DNS requests. By coupling our FlowPro Defender with Scrutinizer’s powerful Flow Analytics, within five minutes we were receiving alarms of a possible infected host. Easily pivoting from the initial alarms directly within a flow report, we could see continuous DNS requests coming from the host every few minutes to NXDomains. This is usually indicative of an infected machine attempting to make a connection to a Command and Control server. All of this information tied together gave the Security team enough information to pull the PC and sandbox it immediately. In this case, they were lucky that the machine never connected to the C2 server and no payload was pulled down.

Since this was a new installation of Scrutinizer, we weren’t able to trend this traffic back far enough to find the root cause. We assumed that the end user clicked a malicious link while browsing or via a phishing email.

These are a few different examples where Scrutinizer and FlowPro were able to provide immediate results upon deployment. I really enjoy sharing these moments with end users, especially in cases where we’re able to prevent malicious traffic on the network!

For more information about securing your network, stay up to date with our blogs.