Competition generally ends up being good for the consumer. It keeps prices down and forces innovation as vendors compete for market share. A great example of this has been the explosion of vendors and features in the SD-WAN market—and from my perspective, one of the best things to come out of this has been the visibility offered from the enhanced metadata exports of the key players.
Silver Peak metadata
Although Silver Peak has supported variants of flow data for a long time, they have generally just been for the basic format: elements like IP addresses, ports and protocols. With version 8.0.3 and later, users can now unlock a wide variety of metadata relating directly to the SD-WAN, Layer 7, and their zone-based firewalling. Looking at the new elements, I think it best to categorize the visibility into three sections.
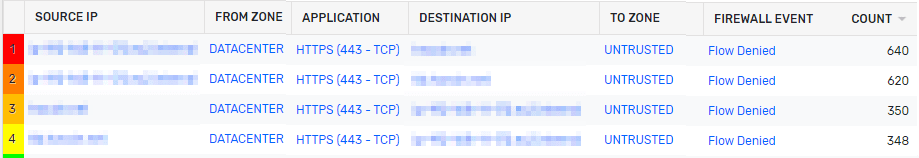
Denied firewall event reporting
One of my favorite firewall-based reports Silver Peak offer is the ability to trend what traffic is getting blocked by application, IP address, and zones. This type of reporting is useful not only for verifying firewall policies, but also for searching for anomalous user or application behavior that may be getting blocked consistently. In the below example, we can see traffic from the data center continually trying to connect to an untrusted network over 443 and getting blocked. Engineers can use this data to investigate the host and see why it is attempting these outbound connections.
Layer 7 reporting
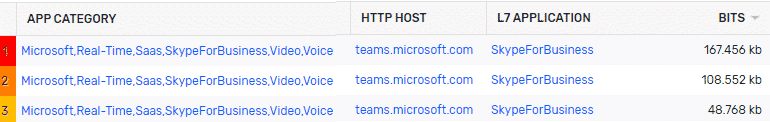
With most of today’s traffic riding over the internet, one of the problems with legacy flow reporting is that application traffic is generally made up of port 80 and 443. Silver Peak has a great implementation for providing visibility up the stack to Layer 7. Where some vendors simply identify the application, Silver Peak also added in category and HTTP host, giving further visibility into the traffic. These types of reports are particularly useful if you wanted to trend all social media traffic instead of having to group multiple filters based off the application name (Facebook, Snapchat, Instagram, etc.).
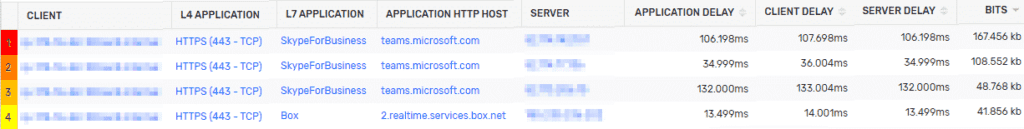
Another useful report in the Layer 7 category centers around latency reporting. Where generic flow data reports on bits/packets, Silver Peak now includes client, server, and application latency metrics for TCP traffic. This reporting is particularly helpful when engineers want to narrow the focus of user complaints to determine if a problem is client-, server-, or application-side.
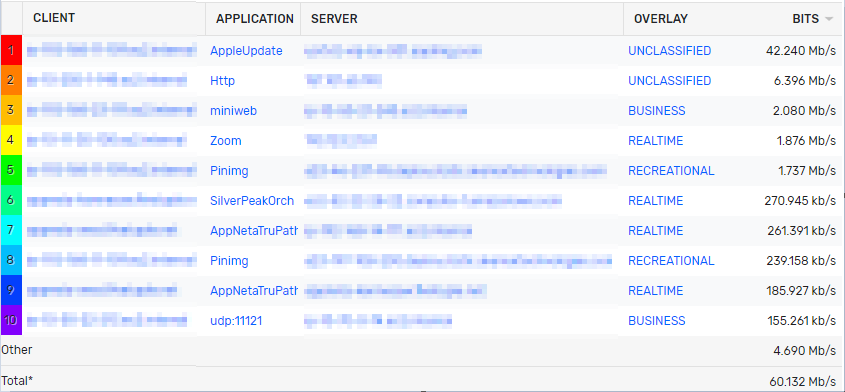
Silver Peak Overlay reporting
Another useful feature of the Silver Peak’s exports is the ability to visualize the traffic specific to different Overlays. Building dashboards or reports centered around this information helps to ensure traffic is taking the correct path and can also clue you in to anything that hasn’t yet been classified to a specific Overlay.
One of the hurdles with SD-WAN deployments is losing the ability to easily follow traffic from end to end. By adding in these rich exporters, Silver Peak is empowering their user base to blend its own metadata together with the core infrastructure in a single next-generation collection system like Scrutinizer. This blog gives a glimpse into what is possible; there are plenty of edge use cases that can be addresses through alerts, threat analysis, and scheduled reporting, all of which we are happy to assist with.