I was working with a customer a couple weeks back and wanted to share a sample Fortigate NetFlow configuration that we came up with. Fortigate firewalls now have support for NetFlow v9 (as of FortiOS 5.2.X). This is pretty big news, since previous versions only support sFlow. There are a few different ways to configure it (from the CLI or the GUI). For the purpose of this blog, I will be showing the CLI commands.
Configuring for your Incident response system:
First, we will need to login to the CLI of your Fortigate firewall and issue the following commands:
config system netflow
set collector-ip <address>
set collector-port <port>
set source-ip <address>
set active-flow-timeout 1
set inactive-flow-timeout 15
These commands will tell the firewall where to send the NetFlow data and on which port. It also allows us to setup an active timeout, which if you have read our previous blogs on this, you know how important it is. Once you have this setup you can also setup sampling/full NetFlow on your interfaces.
config system interface
edit <name>
set netflow-sampler {disable | tx | rx | both}
end
end
Sampling can be useful if you find that your NetFlow monitoring solution is unable to handle the amount of flow data coming in; keep in mind that sampling will also cause you to miss out on what could be crucial traffic that might be traversing your network. I use the example of an advanced persistent threat that has been scanning your network very slowly. In order to track this down you’ll most likely be required to send full NetFlow to your incident response system. Even if you need to do sampling, the information you’ll receive will be far better than what you would have without NetFlow.
Testing your Fortigate NetFlow configuration:
The next step is to test our current configuration and make sure everything is properly configured. Now here is the tricky part that might throw you for a loop. NetFlow does not have a separate daemon on the Fortigate firewall and will run under sflowd. To view/test your current configuration you can run the following commands on the CLI:
diagnose test application sflowd 3
diagnose test application sflowd 4
This will test the NetFlow application on different test levels; keep an eye out for any errors you see, and if all looks good you can proceed to viewing this data in your incident response system.
What does the future hold for Fortigate NetFlow support?
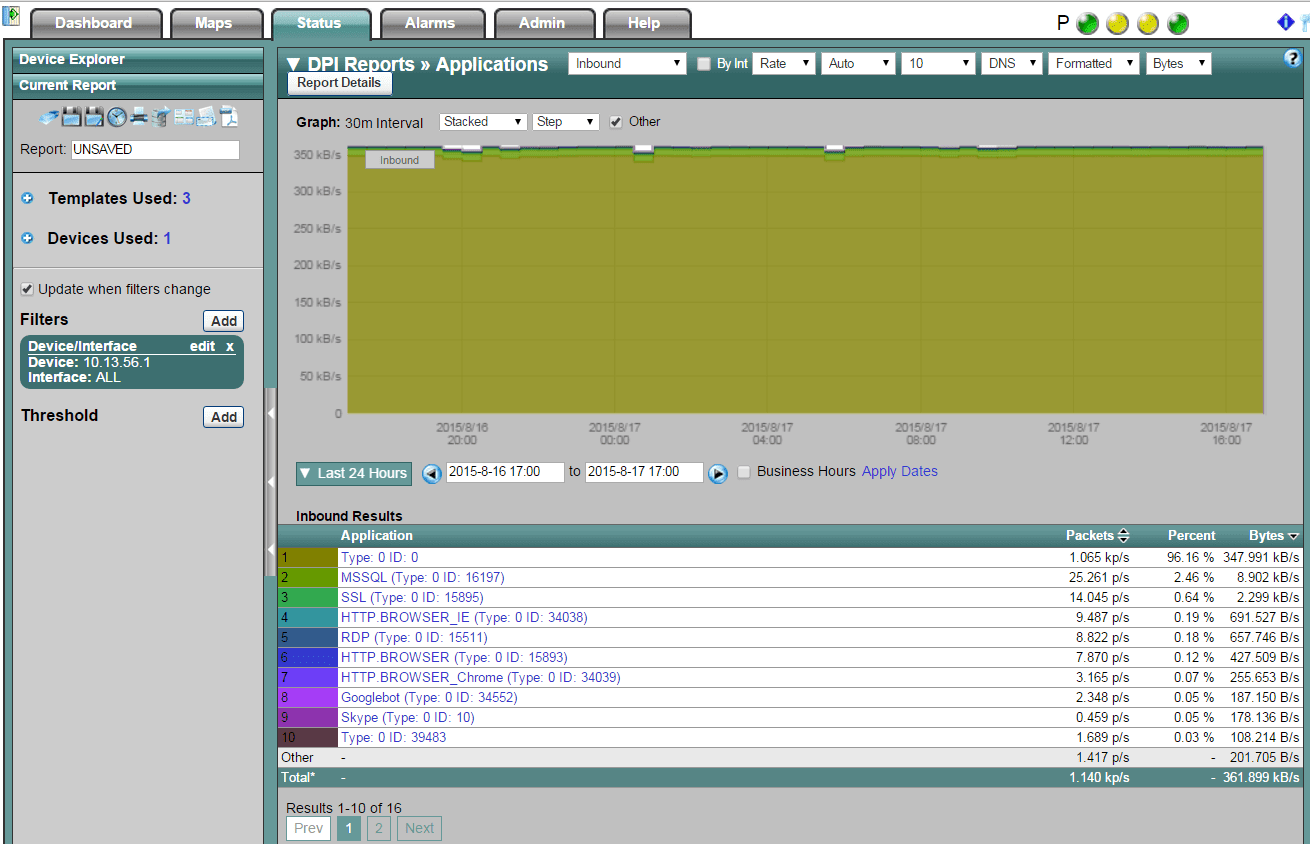
Today, Fortinet / Fortigate will export layer 7 details (i.e. application name) which is very similar to Cisco NBAR. Click on the image below:
The future: with all of the great details we have seen exported by other firewall vendors, such as URL information, latency details and VoIP quality metrics, we hope to see some of these elements get implemented by Fortinet. If you have any questions, or need any assistance on setting this up, please feel free to reach out to our support department.