It seems like every day I talk with network professionals about security and performance, the common theme being speed and ease of use. Having an effective incident response solution is paramount and with more and more vendors supporting NetFlow, it has never been easier.
As I write this, I am 40,000 feet above the Atlantic Ocean on my way to CiscoLive Berlin! We’re very excited to show people the power of a proper NetFlow collector that can help gain visibility and speed up their response time.
As network professionals, you all can level with me and agree that a common bullet point in our daily lives is incident response, whether responding to network performance issues or handling more security-centric matters. We all end up with users emailing, calling, and messaging that either the network is slow or that a serious problem has occurred.
Problem Resolution
With NetFlow, you reduce your incident response time and tackle issues from network performance to security concerns. For example, one of the problems I hear about the most when I am on the phone with my customers is slowness. An end user calls you and, of course, since they are having an issue reaching a resource, it is automatically a network problem.
If you use NetFlow, and more specifically Application Visibility and Control (AVC) capable devices, we can dive deep into the problem. With AVC we can now look into VOIP metrics, application latency, and root cause delay reports.
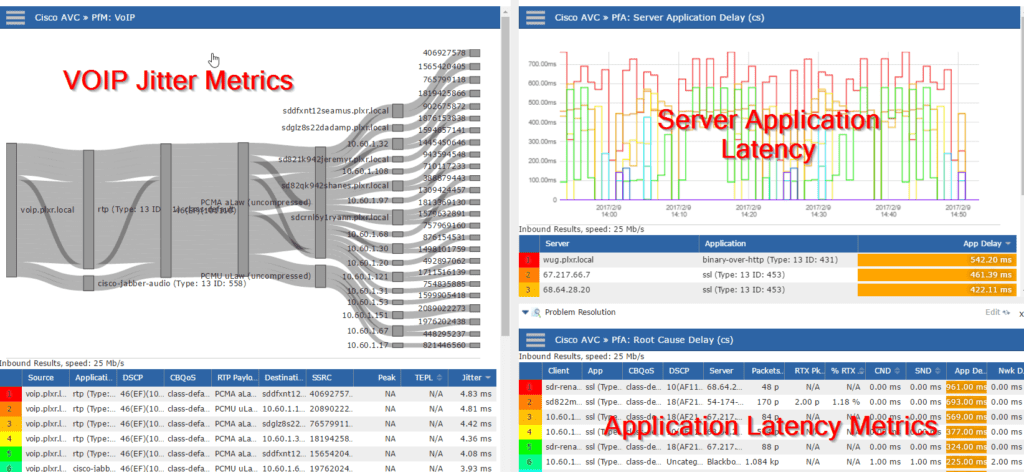
- VOIP Jitter Metrics – This report will quickly tell if my VOIP system is healthy by showing me packet loss and jitter, and then allow me to look at the DSCP tags
- Server Application Latency – This report will give me a quick glimpse at my in-house and cloud-based application servers, letting me know if we are experiencing application delay.
- Application Latency Metrics – The report I am referring to is called the root cause delay report and its goal is to help troubleshoot whether this is actually a network problem or not. I get information like Client Network Delay, Server Network Delay and Application Delay.
With these NetFlow metrics, network professionals can dive right into a user’s traffic and get to the bottom of where the problems actually are.
Bandwidth Management and Accountability
So as you have seen NetFlow can be used to show me some detailed performance metrics, but let’s take a step back and answer some basic network questions. Management and network admins need to know what and who when it comes to network traffic. What is taking up the traffic? Who is doing it? So let’s dig into the flows and answer this.
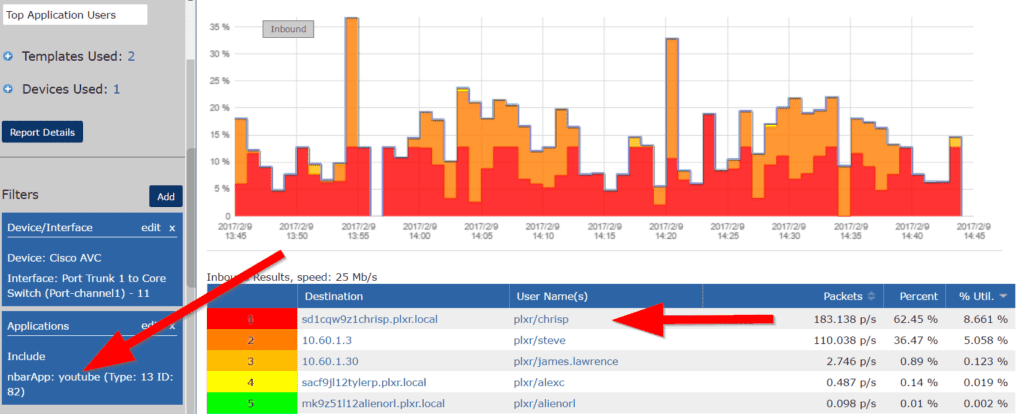
Let me break down the report shown above. I am looking at traffic over my core router’s interface and I have added in an application filter for YouTube. Now I want to see which end user was talking to YouTube. Notice how I said “end user” and not “machine?” With NetFlow you can tie in to login systems like Cisco ISE and Active Directory. That now allows me to see the actual individual that is using this application, along with the system they are logged into at the time. This report shows that user Chrisp was using YouTube more than anyone at the time and taking up over 8% of my 25Mb pipe.
Effective Incident Response
At CiscoLive, I will be showing network professionals how to use the tools that I explained above to reduce their response times and get the answers they need. Maybe it’ll be taking wrongful blame away from the network guys when it comes to slowness or a need to troubleshoot a specific user’s problem. If you would like to discuss how Scrutinizer can be used to improve your incident response, contact our team or download a free trial of Scrutinizer. We can help you harness your existing NetFlow devices today!
Related

5 ways of verifying security risks and avoiding false positives
I think I can safely assume that everyone knows the cautionary tale of the boy who cried wolf. If you don’t, the moral is