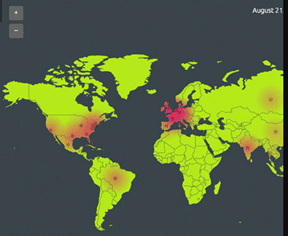
So far we have used the Scrutinizer API to build a dataset that tells us how many hits our top ten countries are getting. Next, we’ll explore how easy it is to use this data to populate an open source digital heat/attack map.
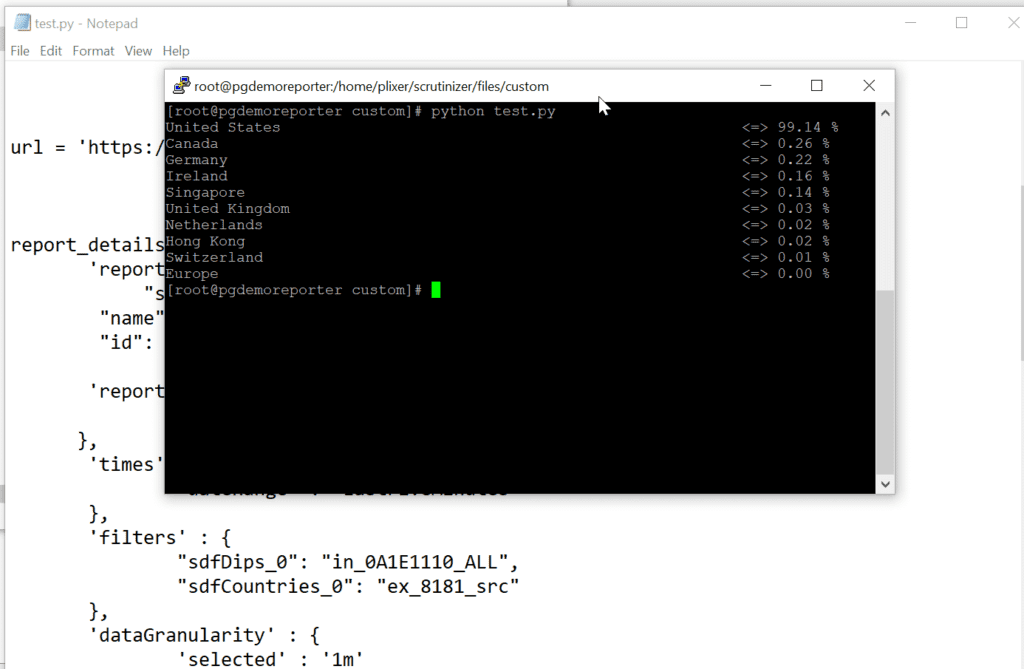
Although there are a lot of heatmap engines out there, I decided to use heatmap.js, written by Patrick Wied, along with the Leadlet Heatmap Layer Plugin.
As you can see from my image, I was getting the names of the top countries and the percentage of traffic that was coming from each. The heatmap.js engine requires the geocoordinates of the place on the map you want to populate along with the size of the traffic. I was only getting the name of the country from Scrutinizer. This meant that I needed to find a way to grab the geocoordinates from the name of the country.
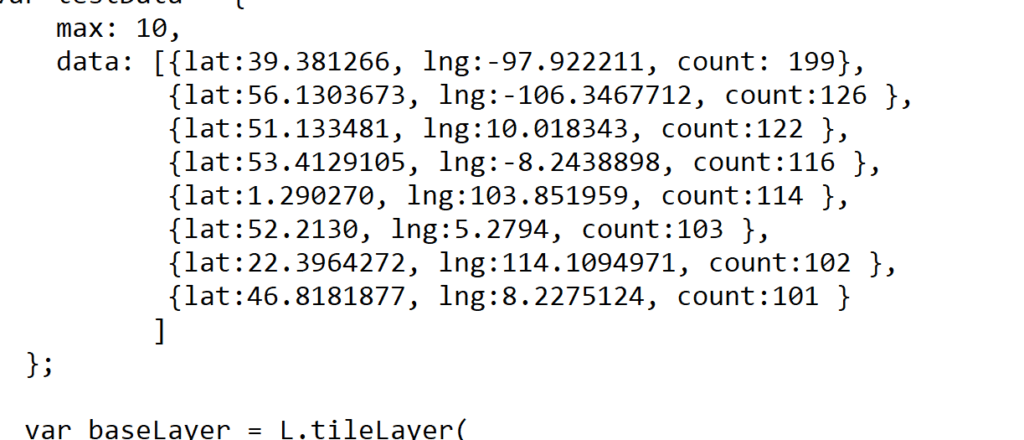
To do this, I used an example of geopy by Chris Albon. With a few lines of Python code, I could pull the coordinates and populate my data set with the name, the number of visits, and the geolocation form my Scrutinizer call. All that was left to do was to write the data to the JavaScript file that I would include in my HTML page. Here is an example of how the data needed to be formatted.
After some general troubleshooting and a couple cups of coffee, I was able to see my map populated with data!
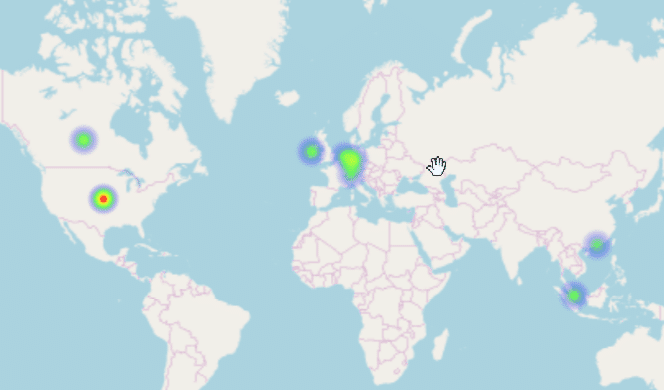
At this point I had a working model of my map, but it isn’t dynamic because it’s based on that one call for data. To remedy this, I would add the Python script as a CRON task to execute every five minutes or so. By doing this, the script would refresh the data segment of the JavaScript file and we would have a dynamic map.
Ok, so we can dynamically generate the data needed by the heatmap engine; now we need to make it useful. It’s all about context, right? Just seeing a hot spot on a map isn’t going to answer why it’s that hot.
That’s where Scrutinizer’s dashboard engine comes into play. It allows you to build a view that tells a story of what’s going on. First, let’s add our map to the dashboard.
- Click on the Dashboards tab and then click on the dashboard you want to put the map on. If you don’t have a new dashboard, skip to the next step
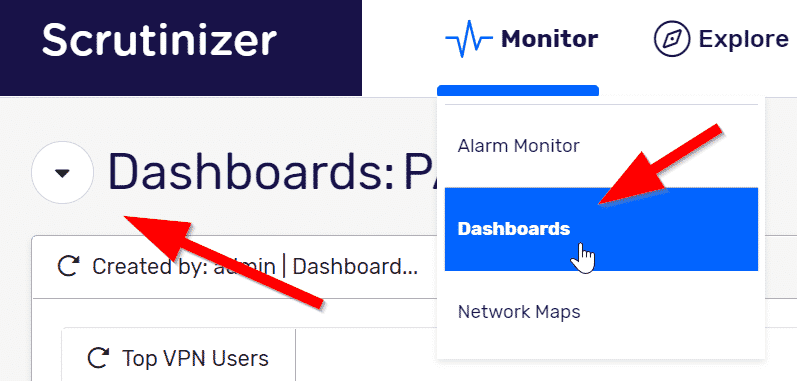
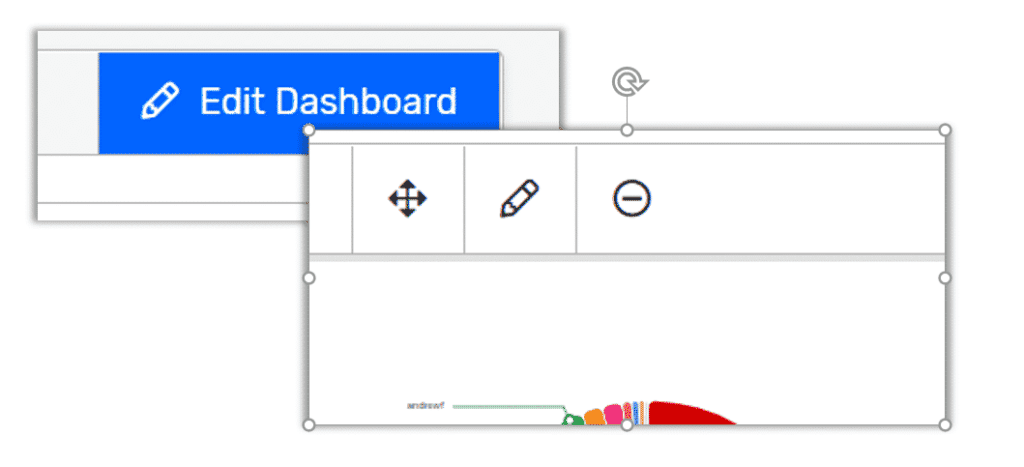
- Click on the Edit Dashboard link. Here is where you can add a new gadget. You can also create a new dashboard.
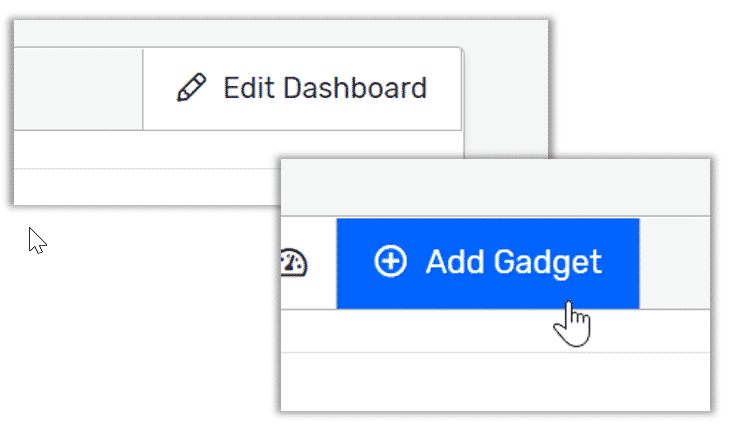
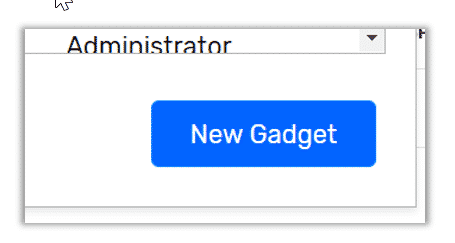
- In the pop-up screen, you will see all the gadgets that are available to you. With Scrutinizer you have three types of gadgets. The first gadget is one that we created. These are the ones included with your Scrutinizer install. Second, there are gadgets that you made from a saved report. Remember, any report that you save in Scrutinizer is a dashboard gadget. The third type of gadget is one that you created yourself. An example would he our heatmap! To add this gadget just click on the New Gadget button.
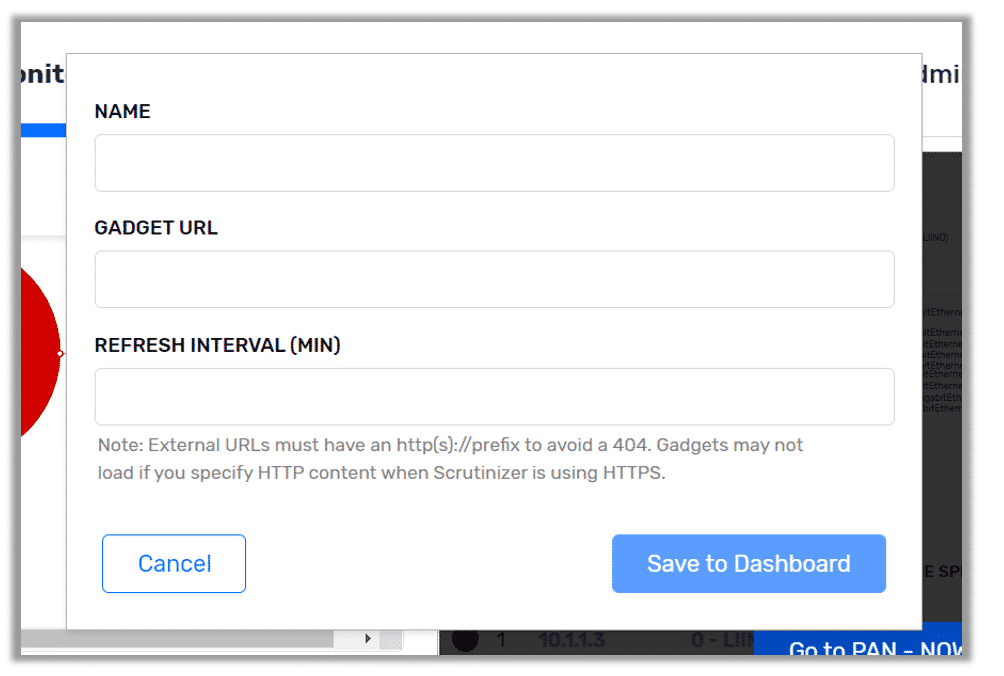
- Here you will give your gadget a name and provide the URL of the gadget.
- If you later want to change the name of your gadget, the URL, or the refresh rate, all you have to do is click on the gear icon for that gadget.
- Finally, you would populate this page with other “contextual” information. In my example I added a Source > Countries with AS report and Host with Country report. With this, I have one view that gives me a better understanding of what is going on at the moment.
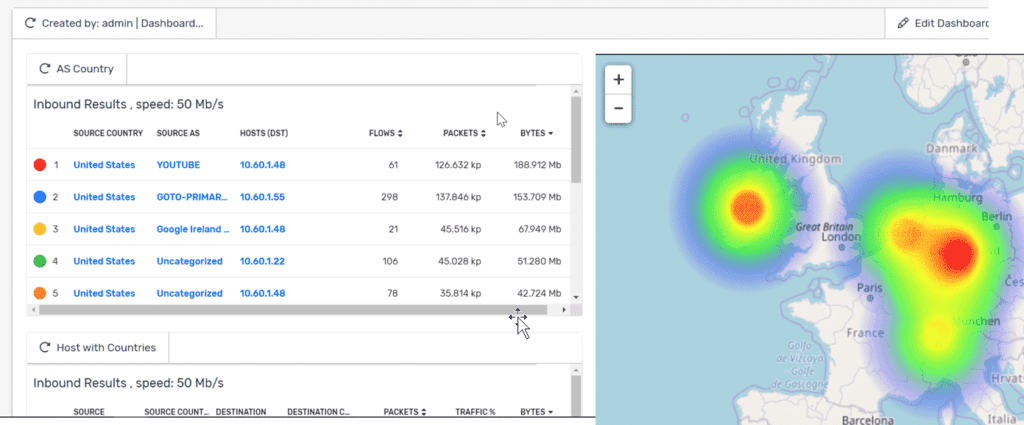
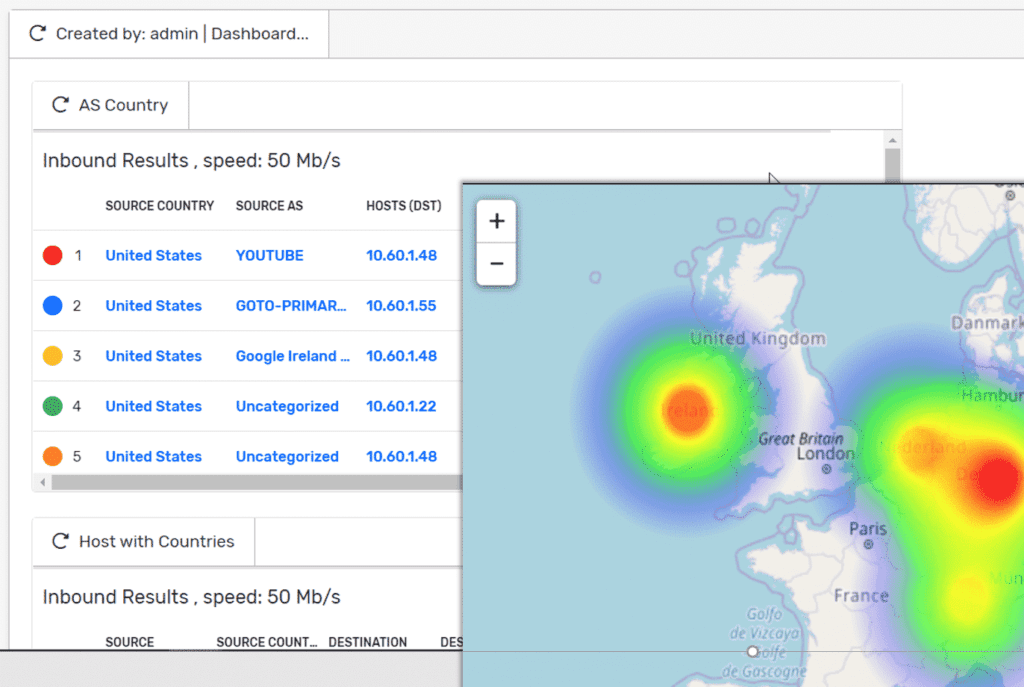
So there you have it: a great example of using Scrutinizer’s API to populate an external tool. I’m sure that you can agree that this opens a lot of doors as to what your NetOps and SecOps teams can see with your conversation data.
In today’s world, there isn’t a one-stop solution to network security. The ability to easily integrate data into another application is what makes the best toolbox. Are you looking for conversation-rich visibility along with the flexibility to integrate that data into your current environment? Why not evaluate Scrutinizer?


