
NetFlow can give us all kinds of rich information about our network infrastructure. You’ll find standard fields with information like source and destination and routing details along with advanced fields which give you information like network communication delay, RTP metrics, or DPI application labels. Exported as a standard field from most devices, TCP Flag aggregates can provide more insight into what your flow data is telling you about network activity.
The TCP Flag aggregate field shows the set of TCP flags that were observed in a flow. Since one flow is comprised of many individual packets, the TCP flags are collected from each packet. In Scrutinizer, we expect flow exporters to be configured with an active timeout of 60 seconds. This means each flow is recorded from the flow cache and sent to the collector after 60 seconds. If a timed-out flow is still active, a new flow is inserted into the exporter’s flow cache to allow for the next 60 second ‘chunk’ to be aggregated. This paradigm will enable us to go back and review the sub-intervals of long-running flows.
As a quick review, the TCP Flags are defined as follows:
- Syn – The Synchronize flag is the first sent to begin a TCP connection, specifically this flag calls for the hosts to synchronize sequence numbers used to track the connection.
- Ack – The Acknowledgement flag confirms the receipt of the prior segment.
- Fin – The Fin flag signifies a proper termination of the connection, as there is no more data to transmit.
- Rst – The Reset flag allows for the spontaneous termination of a connection
- Urg – The Urgent flag will set the payload data for instant processing when received. This circumvents the buffer possibly full of other data from the connection.
- Psh – The Push flag tells TCP I have no more data for this payload send now.
Additionally, there are two other flags (ECN and CWR) used to denote congestion in the path of communication.
Reviewing TCP Flags in NetFlow
With these flags in mind, we can now look at flows and determine which phase of the TCP connection it represents and troubleshoot application behavior. Viewing these fields is accomplished by using Scrutinizer’s Flow View.
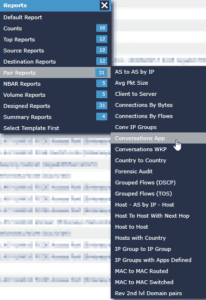
To access Flow View, first open a standard report like ‘Pair > Conversation App’:
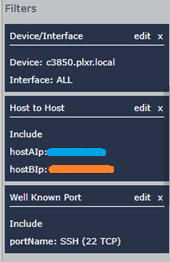
Next, select filters for the report to represent the traffic you are interested in reviewing:
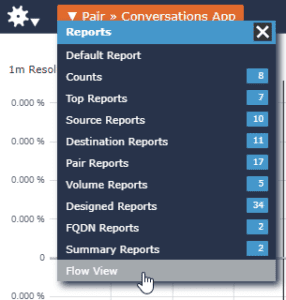
Now we will pivot the report type to ‘Flow View’:
From Flow View, we have atomic data presented as it was collected without any additional presentation. Here we can review the TCP Flag aggregates.
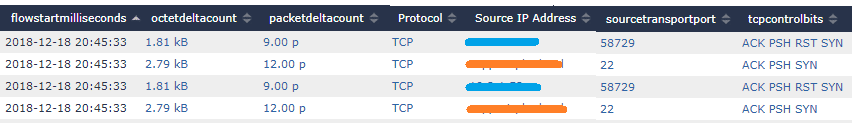
In this example from Flow View, we can see the blue host establish an SSH connection to the orange host. This is determined by both the presence of a SYN flag in the first rows aggregate field and the use of an ephemeral source port (destination port of 22 is also visible but out of frame). Additionally, we can see SYN/ACK and PSH flags from the orange host, implying that the connection from blue was accepted (SYN/ACK) and a real-time application like an SSH terminal session was active (PSH). Ultimately, we can see that the blue host abruptly terminated the session given the RST flag. This would have closed a session where a formal end (FIN) had not.
Scrutinizer takes TCP flag review a step further. Our Flow analytic algorithms are always watching for behavior that indicates anomalous behavior regarding TCP flags. SYN scans, RST/ACK detection, and Null scans are just a few examples among many designed to help you detect issues in your network traffic. Check out Scrutinizer and see what the applications on your network are up to!