We took some time recently to get our Splunk NetFlow integration working. Apparently, there are a few customers who are looking to get from NetFlow to Splunk and from Splunk to NetFlow. This of course applies to IPFIX and sFlow as well.
In order to set this up, we visited the Splunk developer page and learned about the basic process for developing a Splunk application. The basic process is as follows:
- Get data into Splunk using data inputs, indexes, and modular inputs. Follow the logging best practices.
- Search your data using the Splunk search language and optimize your searches (filter, limit scope, avoid real-time searches).
- Enrich the search with Splunk knowledge objects such as saved searches, event types, transactions, tags, field extractions, transforms, lookups, search commands, and data models.
- Visualize your data by creating visualizations and dashboards.
- Create alerts using both out-of-the-box alert actions, as well as custom alert actions to integrate with other systems.
- Certify, package, and publish your app to Splunkbase.
Put Your Flows in Splunk?
After reading the very first step {get data into splunk} I almost fell out of my chair. I’m kidding of course but, this didn’t seem like a reasonable option to me as flow data can be very voluminous. For some of our customers, this is in the magnitude of 100K flows per second per collector! I’m not familiar enough with Splunk to be sure if it can ingest this type of volume but, I knew this could create other issues for our customers as well.
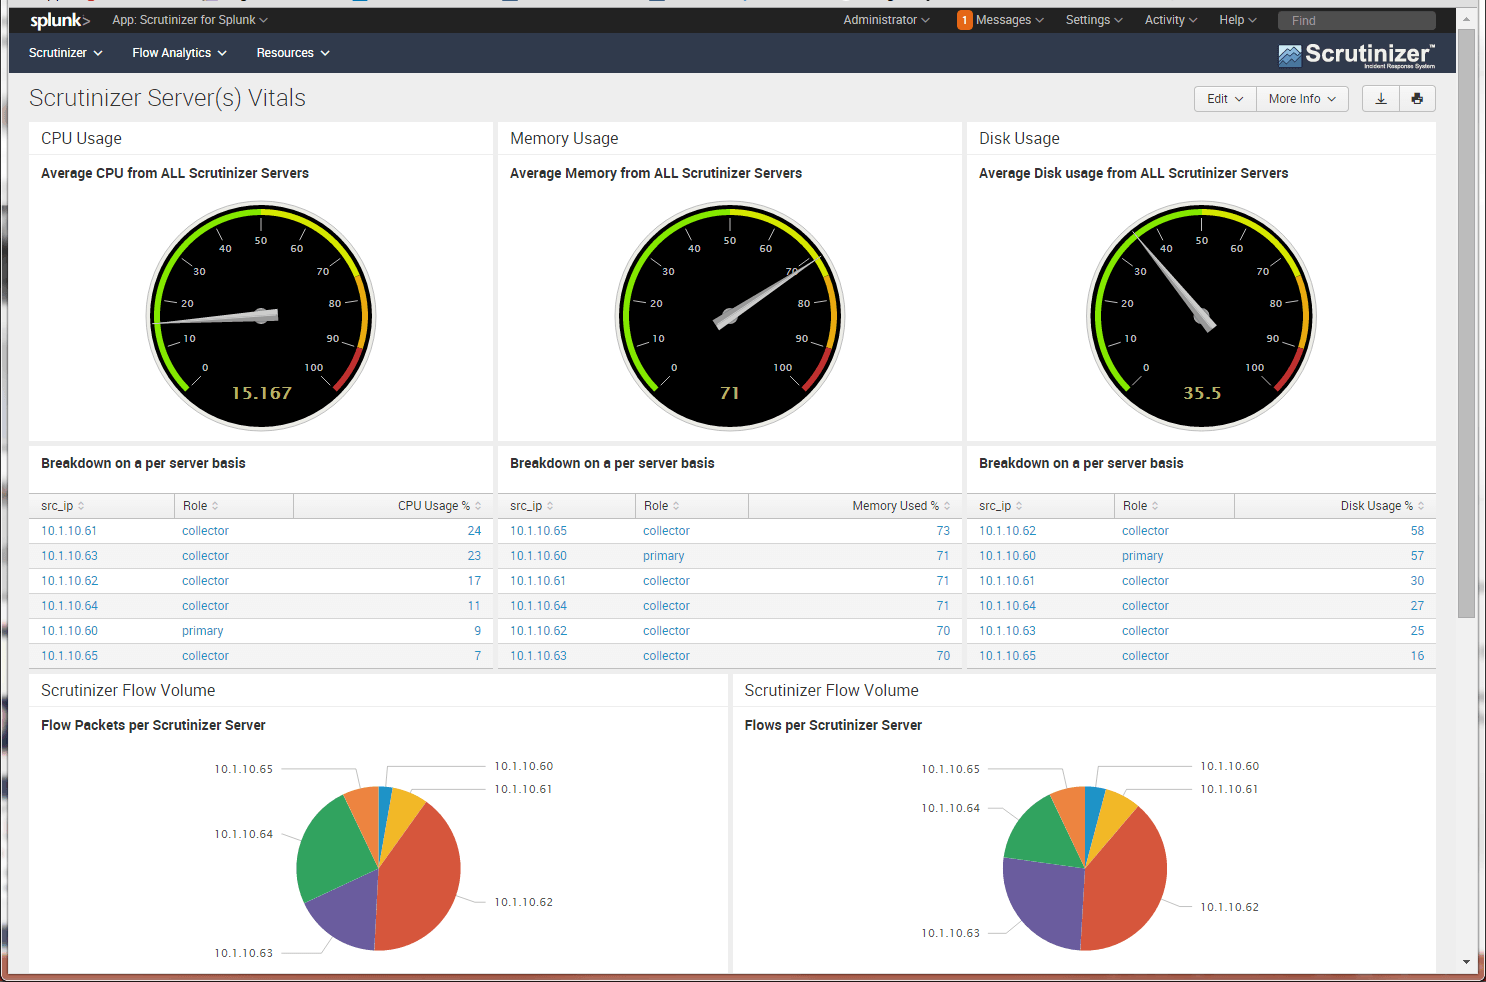
Putting the flows in Splunk would also mean that we would be forced to build a reporting interface in Splunk. This I’m sure would be an incredible amount of work. Likely years in fact if we hope to have the same level of flexible reporting that is appreciated today in Scrutinizer NetFlow Analyzer. As a result, I decided to start with the reverse: get to the Splunk data from the NetFlow. The flows of course are inside Scrutinizer. Getting this to work we found, was much easier.
Splunk NetFlow Support
We wanted to create a way in Scrutinizer that allows the user to click on an IP address and select the Splunk menu option. Then, by selecting ‘Splunk’ it would pass the time frame and IP address variables in a URL string. I was in luck because our developer figured out that Splunk allows this. Apparently, you need to edit a file called application.cfg in the /files/ directory in Scrutinizer. The following entry must be added:
Splunk, http://<ip_or_host_to_splunk>/en-US/app/search/search?q=%i&display.page.search.mode=smart&earliest=%s&latest=%e, Splunk
With the above in place, run a report in Scrutinizer and click on a host. In the example below we clicked on flowpro (192.168.2.23) and selected Other Options > Splunk:
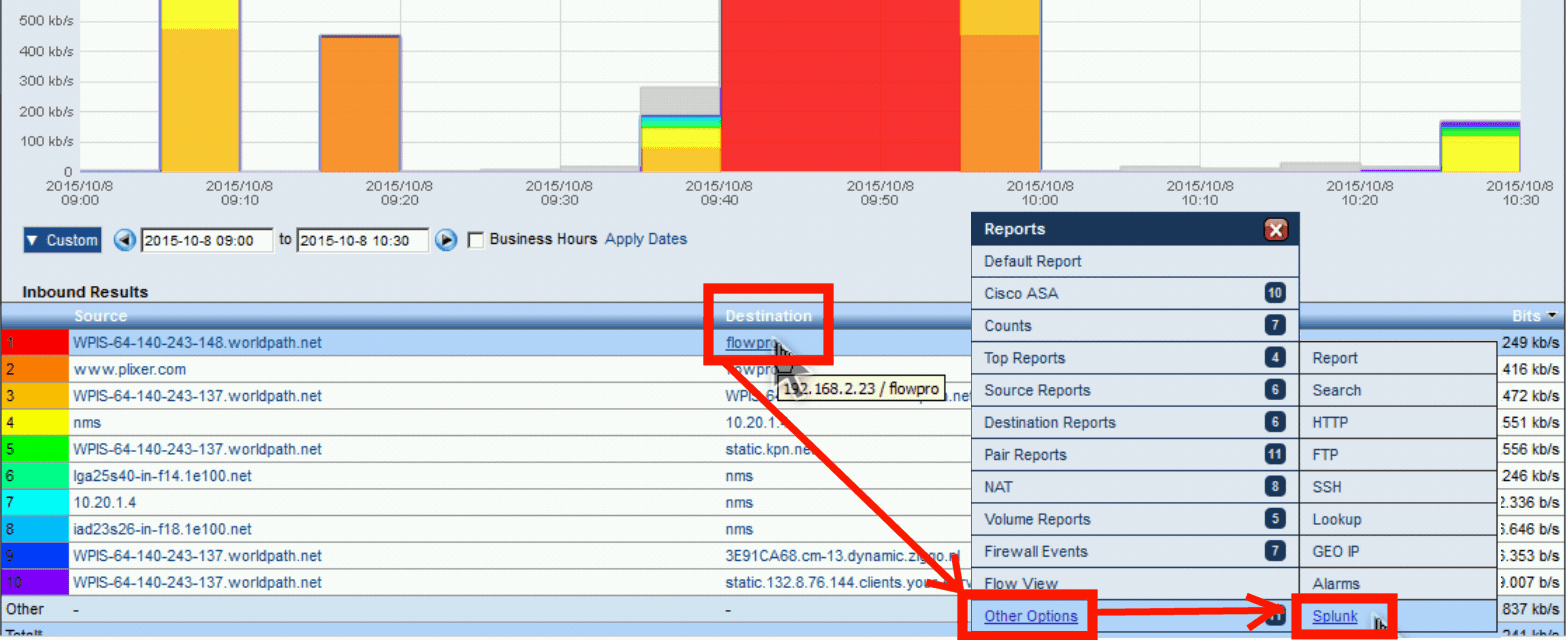
By selecting the above option, a browser is launched as shown below. Notice the URL at the top:
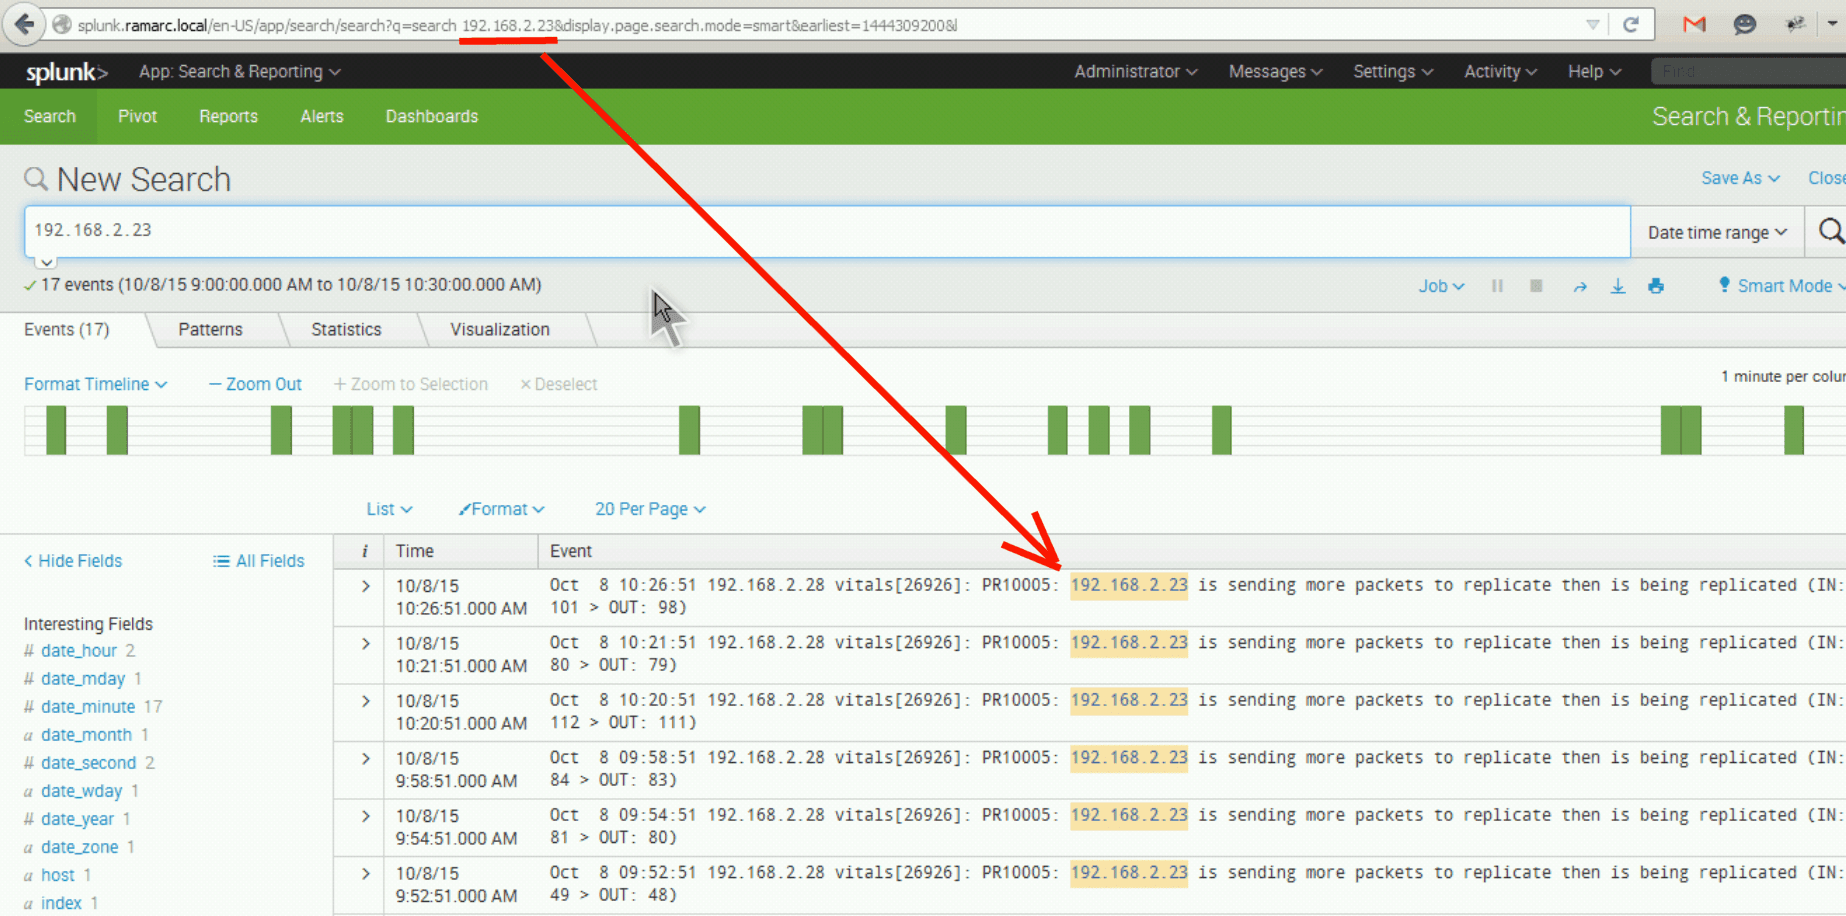
You can see the IP address 192.168.2.23 passed in clear text. The time frame however is passed as an epoch value. Paste the number: 1444309200 that is shown at the end of the URL into an epoch converter and you’ll see the time frame is 10/8/2015, 9:00:00 AM GMT-4:00 DST. Don’t worry, this conversion is done by Scrutinizer.
BTW: We also setup Elasticsearch NetFlow support with Kibana.
Further Splunk NetFlow Integration
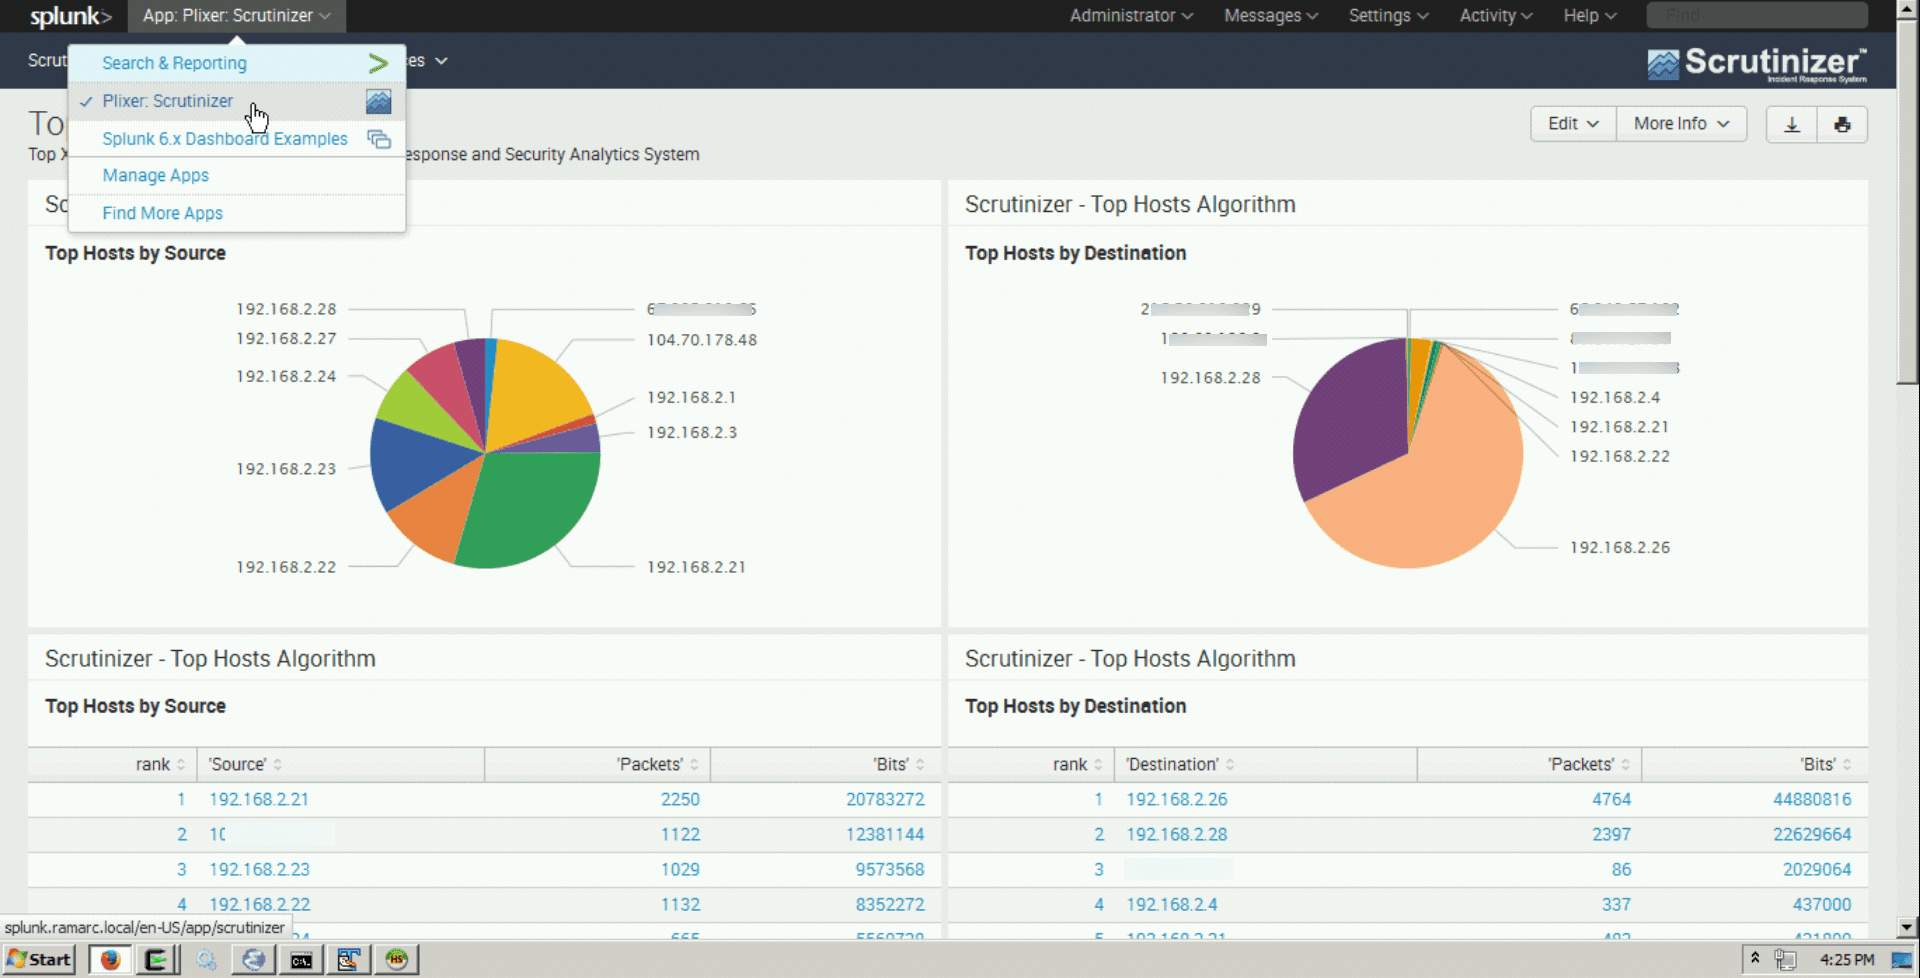
As a result of the Splunk NetFlow Integration work we did, we can now jump from an IP address found in NetFlow to the Splunk system. Splunk will then display the events for the host for the selected time frame. We can also do the same thing in reverse. You can jump from an IP address in Splunk to the NetFlow data in Scrutinizer for the corresponding time frame.
Reach out to our team with any questions on how to set this up.