Network and security teams collect flow and metadata to provide an accurate account of applications traversing the network. Another aspect of troubleshooting poor application performance is ensuring that QoS is being used properly. This blog will go over how collecting NetFlow/IPFIX data can easily help monitor and alarm on any new or existing QoS issues.
Monitoring QoS
The first step in monitoring QoS is to check that we are collecting the correct elements. For most routers/switches this will be DSCP/Type of Service markings or class-based QoS metrics (such as queue drops). If you haven’t already, I highly recommend checking out our configurations page to find the best setups for your exporters.
Common QoS monitoring use cases
The most common use case I hear when working with customers is monitoring VoIP environments. The easiest way to do this is to use Scrutinizer’s IP groups functionality (this can often be integrated through APIs with your IPAM solution such as Infoblox or BlueCat). You will want to define your voice VLANs so you can use Scrutinizer’s dynamic filters to easily sift through traffic.
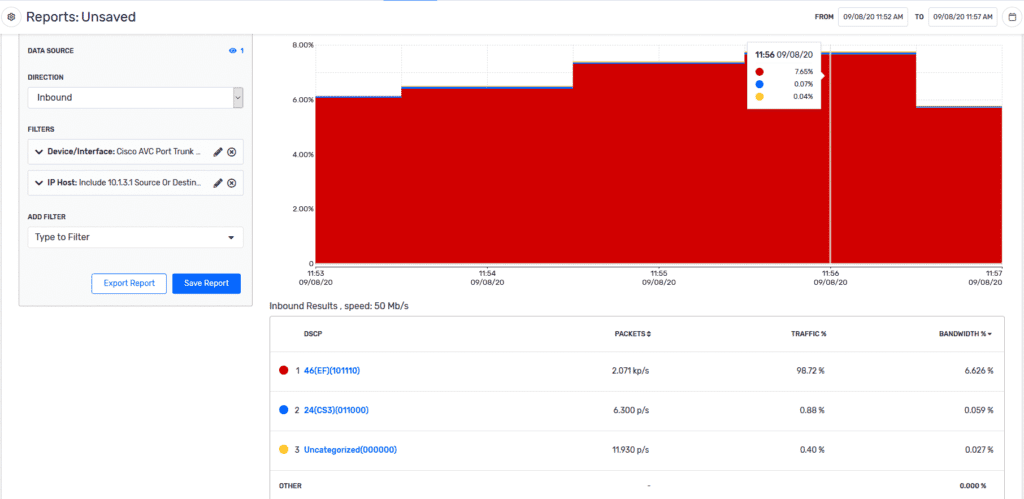
The image below shows a sample report of traffic sourced from and destined to our on-prem PBX. Pretty much all of the traffic on the graph shows it being tagged as 46(EF), which is what we expect. At this point, it would look like all of our voice traffic is being tagged properly and no phones have come online provisioned improperly.
Make note of the report and any filters applied—in this example I am looking at a core router and running a Top – DSCP report. I have an include filter for our PBX, but you can easily change this to a subnet or IP group.

DSCP looks good, now what?
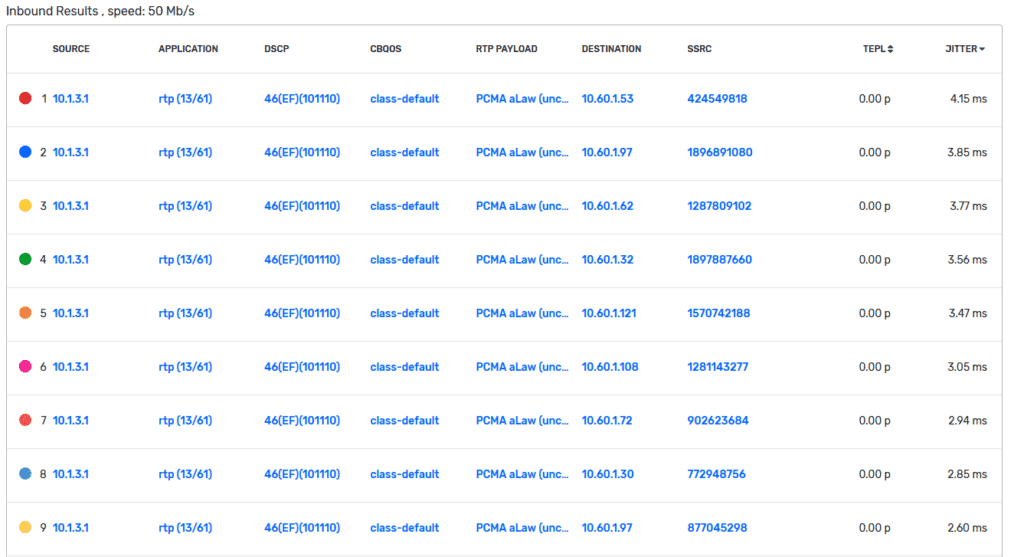
If ToS/DSCP looks good and the application is still having problems, we can use additional metadata elements from our FlowPro APM or other DPI exporters. This can add much more granularity to existing reports and additional elements such as jitter, packet loss, retransmits and network latency. The report below shows an example of some VoIP traffic we collected. In this example, we can see that these calls are all hitting our class-default QoS class as well as any jitter experienced. From here we can easily change the configuration of our voice gateway and look like a network hero!

What’s next for QoS monitoring?
Now that you have created some reports and views specific to your application environment, I would recommend adding this to a dashboard or possibly applying a threshold to this report to alarm in the event that Jitter or DSCP is being tagged properly. If you have questions or if troubleshooting QoS issues keeps you up at night reach out to our team!


