In part 2 of my blog series Exinda NetFlow reporting, I will continue showing the reports available in our advanced NetFlow reporting solution.
When Exinda introduced the ExOS 6.0 operating system, the release included enhanced monitoring, reporting and acceleration capabilities. A key feature of the new release was its compatibility with NetFlow version 9 from Cisco Systems. NetFlow extensions enable both heuristic and deep packet inspection, and reports on user identification, application groups, application response, service level agreement measurements, and utilization.
In part 1 of this series I focused on how Exinda NetFlow reporting uses deep packet inspection (DPI) to offer full layer 7 classification information as part of the flow records.
Today I am going to show you more of the Exinda NetFlow reporting that is available, such as Round Trip Time, network delay, server delay, network jitter, bi-directional bit/byte and packet loss, HTTP Host reporting, policy statistics and AD username information.
So let’s take a look at the increased visibility that can be gained with Exinda NetFlow reporting.
The reporting engine dynamically makes Exinda NetFlow reports available based on what data export options were selected during the NetFlow configuration.
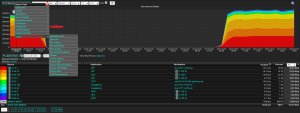
From an Exinda device report menu you can select from a number of unique vendor reports.
From the report menu you can see how with Deep Packet Inspection there is a get deal of information that can be gathered, exported, and reported on using NetFlow. Performance metrics such as latency, jitter and packet loss are available using Exinda NetFlow reporting.
When integrated with Active Directory, monitoring and trending the end user experience, using performance metrics, can be done on both a reporting and an analysis level.
Do you need to set network priorities or acceptable use policies, or monitor how effective your policies are working?
Network administrators often need to create custom streaming policies to prioritize network traffic and set acceptable use parameters. Network policy identification and reporting with NetFlow lets you monitor and trend how those policies are being met.
The HTTP Host reporting gives network administrators additional insight, beyond the Layer 7 application visibility. You can use your NetFlow Collector to see reports, i.e. HTTP Host, and filter on them by User or workstation.
The bottom line – What You Can’t See Can Hurt You
When end users complain about slow applications on the WAN, many network administrators have no idea why. They are essentially flying blind when it comes to addressing poor network performance, slow applications, bandwidth congestion or the need to prioritize critical applications like voice over IP (VoIP).
Using the report filtering available in these Exinda NetFlow reports, the network administrator can not only visualize the traffic traversing the network, they can set minimum performance thresholds and receive real-time alerts if the levels are unmet.
Are you ready to see this type of reporting from your Exinda WAN accelerator?

