Who has the time, right?
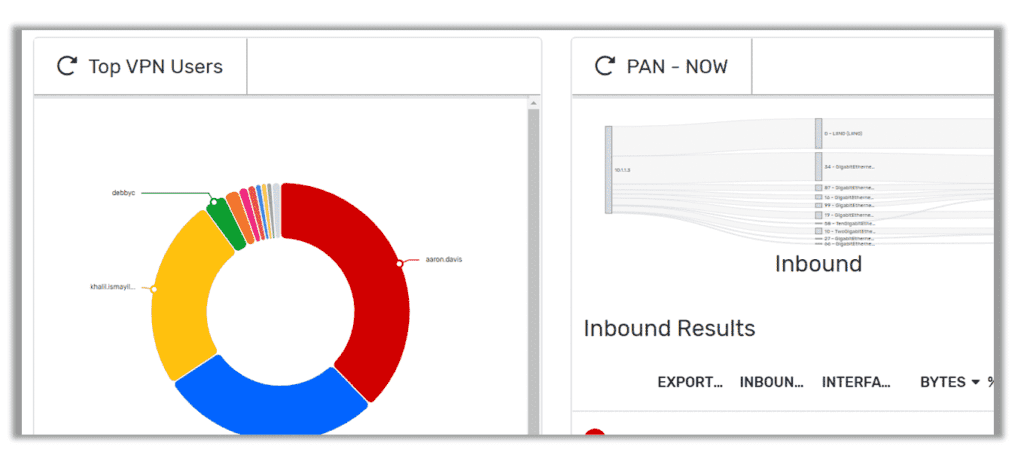
You might laugh but the truth is, in the past few weeks you have become the guru of everything VPN on your company’s network. Questions are coming in left and right, and with a little time you have been able to dig into the data to find out who were your top VPN users, what applications they were using, and how your VPNs have been holding up.
The problem is that you never planned or this. Matter of fact, no one planned for the amount of remote work we see in today’s world. This isn’t going to change much in the near future, so reporting on and monitoring your VPN tunnels will remain a larger part of your daily workflow.
Last time you checked, there are only 24 hours in the day and now you have to add this to the lot of to-dos.
Luckily, managing your VPN tunnels doesn’t need take up a big part of your day.
I’m taking this example from a real-world situation that a customer of mine was dealing with the other day. Basically, this admin’s workday had changed drastically. Let’s call her Molly. She was constantly fielding support calls from remote workers at all levels, and it was starting to take a big bite out her normal availability. The good news is that management has moved up this extremely handsome and super intelligent (but still noobish) guy from the help desk to assist. Let’s call him Jim. Well, as I mentioned, Jim has the foundation needed to monitor your VPNs, but the time just isn’t there to get him up to speed on building the reports and digging into the current VPN situation.
All isn’t lost. Molly has been using contextual metadata, like NetFlow and IPFIX, to monitor the company’s traffic. In the past she learned that since your VPN is an extension of your network, and part of that flow, she could easily build a report to show things like who are the top consumers of that tunnel over time etc. Best of all, she could use what she had already done to create a dashboard for Jim.
He can now help her lessen the workday load!
Step 1: Let’s build a users report

In this example I’m building the report on my firewall, which is the management engine for my VPN connections. In my previous post about monitoring VPN applications, I filtered for my VPN range and a specific interface, but in this example VPN management is all that this device is used for.
The users report will give me the view that I’m looking for, so I made sure to choose it. At this point we can see all of our VPN users and the associated data.
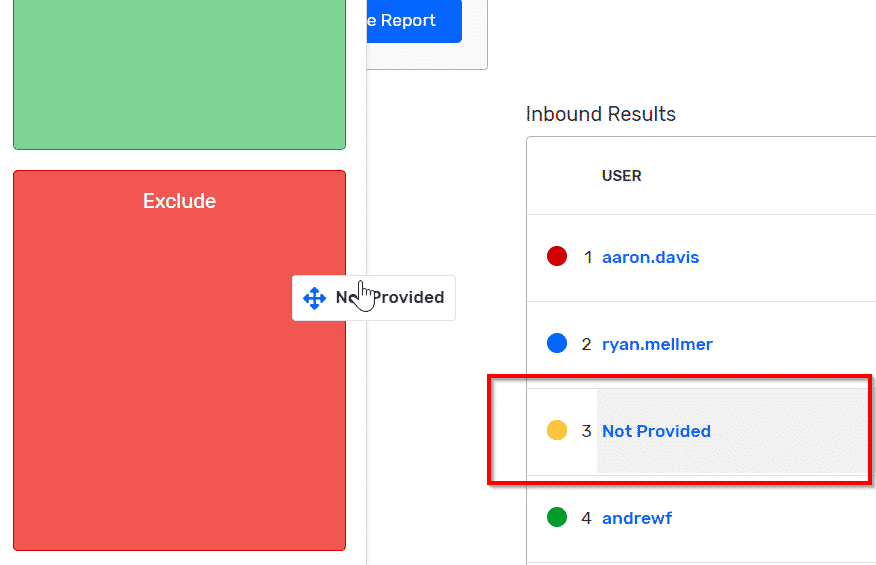
I also see a username labeled “Not Provided.” This is unauthenticated traffic and not related to what I need to see in my VPN reports, so I am going to exclude that by dragging it and setting it the red box on the left-hand side of the screen.
Step 2: Let’s save this report under multiple timeframes.
Now that we have found the data that we were looking for, we need to make sure we can pull it up when needed. We really don’t want to go through all these steps again. We’ll select the desired timeframes for the three VPN user reports that Molly wants Jim to see.
The first report is the “Now” report that will show all the VPN users in the last five minutes. Just click on the report settings icon (the little gear next to the report type name) and under “Range,” choose the last five minutes. To save the report, click on the tiny floppy disk located over on the left-hand side of the screen.
To create the next two reports, just use the “Save As” function (the two floppy disks), rename the report, and repeat the previous steps.
Step 3. Let’s add these to a users dashboard.

Since the dashboard engine is unique to each and every user, we can build the dashboard with the information that Jim needs to see. Now when Jim comes to work in the morning, he can check his dashboard to make sure nothing weird has changed. Best of all, you can save any report as a dashboard gadget. All that you need to do is click on the four squares icon.
Learn more about creating Scrutinizer Dashboards here.
In today’s ever-changing world, we are faced with a high number of remote employees. Making sure that those employees have access to their day-to-day applications has taken priority. Are you looking for conversation-rich visibility along with the flexibility to integrate that data into your current environment? Why not evaluate Scrutinizer? (and see my video of this example!)


