
I recently helped a customer configure NetFlow on their ISR4300. I found that ISR43XX/44XX routers run IOS-XE, which only supports Flexible NetFlow (FNF). NetFlow is a Cisco technology that provides statistics on packets flowing through the router. It’s the standard for acquiring IP operational data from IP networks.
Flexible NetFlow improves on previous versions of NetFlow by adding the capability to customize the traffic analysis parameters for your specific requirements. Flexible NetFlow facilitates the creation of more complex configurations for traffic analysis and data export through the use of reusable configuration components.
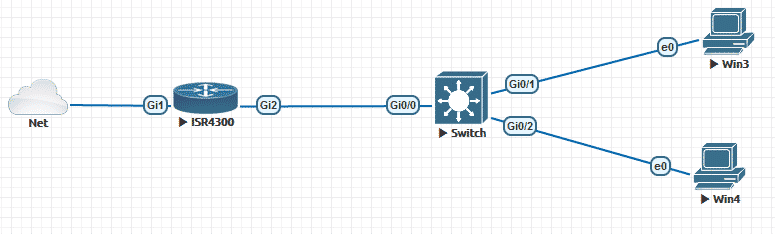
I will be showing the IPFIX configuration based on the diagram below:
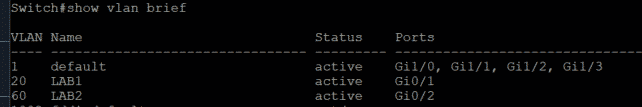
Here is the output from the switch where we want to highlight the VLANs we have created.
Here are the steps to configure IPFIX on a Cisco ISR4300:
- Create two flow records, for Layer 2 and Layer 3 respectively.
- Create a common exporter for both L2/L3 configurations.
- Create two flow monitors; each will have separate flow records but the same flow exporter.
- Create a default sampler for each of the flow monitors.
- Apply two created flow monitors under same interface.
flow record Plixer-L3
    match ipv4 tos
    match ipv4 protocol
    match ipv4 source address
    match ipv4 destination address
    match transport source-port
    match transport destination-port
    match interface input
    match flow direction
    match application name
    match routing source as
    match routing destination as
    collect routing next-hop address ipv4
    collect ipv4 dscp
    collect ipv4 id
    collect ipv4 source prefix
    collect ipv4 source mask
    collect ipv4 destination mask
    collect transport tcp flags
    collect interface output
    collect counter bytes
    collect counter packets
    collect timestamp sys-uptime first
    collect timestamp sys-uptime last
    collect ipv4 destination prefix
Name your flow record for Layer 2 (e.g. “Plixer-L2”):
Flow record Plixer-L2
    collect datalink destination-vlan-id
    collect datalink source-vlan-id
     match datalink destination-vlan-id
     match datalink mac destination address input
     match datalink mac destination address output
 !
Name your flow exporter (e.g. “Plixer-exporter”):
flow exporter Plixer-exporter
  destination 10.30.16.80
  source GigabitEthernet1
  transport udp 2055
  export-protocol ipfix
  option interface-table
  option application-tableflow
  option application-attributes
 !
Name your flow monitor for Layer 2 (e.g. “L2m”):
flow monitor L2m
 description Monitoring Layer2
 exporter Plixer-exporter
 record Plixer-L2
 !
Name your flow monitor for Layer 3 (e.g. “L3m”):
flow monitor L3m
     description Monitoring Layer3
     exporter Plixer-exporter
     record Plixer-L3
 !
 !
Name your sampler (e.g. “L2sampler”):
sampler L2sampler
     mode deterministic 1 out-of 100
 !
 !
Apply the configured flow monitors under the required interface:
interface Ethernet0/1
     ip flow monitor L3m sampler L2sampler input
     ip flow monitor L2m sampler L2sampler input
Once you’ve applied the flow monitors under the required interface, it’s time to take a look at Plixer Scrutinizer and see the outcomes. As you can see, now we can bring up Layer 2 related information:
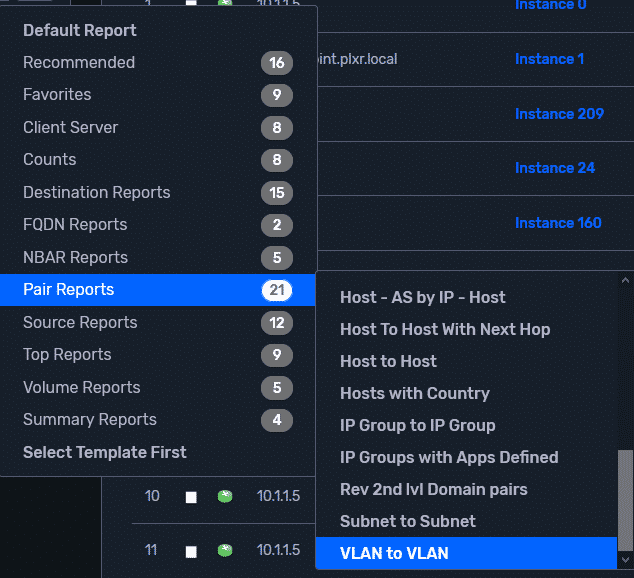
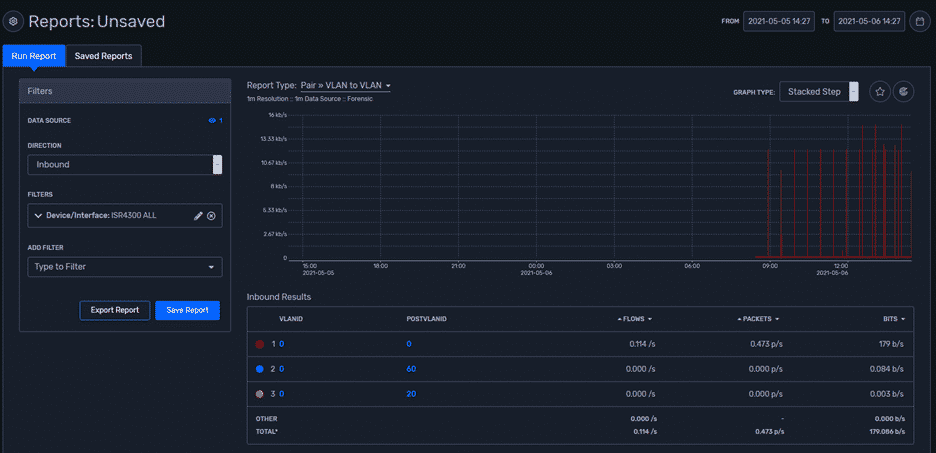
Besides traditional reports, we can also look into VLAN-to-VLAN conversations as well. In the output above, we see both VLANs created initially (20 and 60) and the native VLAN (0). The main purpose of this blog was to highlight the difference between two layers and to define what can be applied under each of them to avoid any conflicts during configuration itself. If you’re having difficulty, give us a call. We’ll be glad to walk you through it.