
If you use Cisco’s wireless solutions or Aruba Wireless, you already know how important impression tracking is. There are some strong IPFIX elements that Plixer supports for both platforms and one of the benefits becomes correlation of that data with other systems in the network. Jeff Morrison, one of the other engineers here at Plixer, discussed this in his blog last week and I would suggest reading that first.
Gather and visualize the data
Configure the flow record on the access point’s so Scrutinizer can begin gathering the flows, then run a report that shows client connections within the specified timeframe across ALL access points (APs).
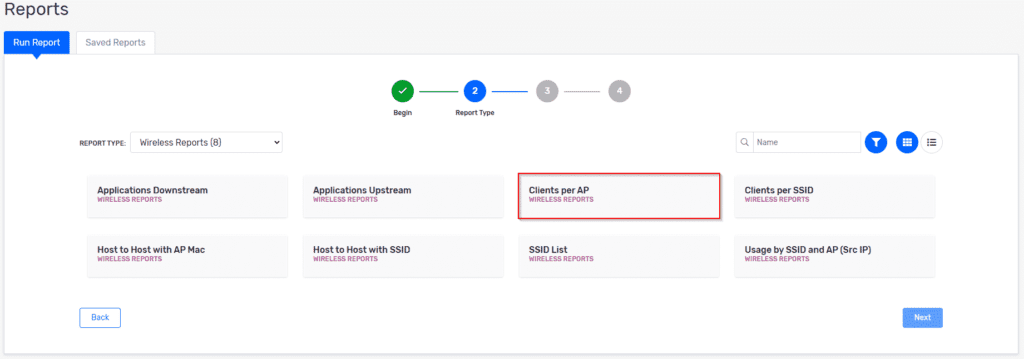
We can narrow down the results BEFORE we add a custom filter or pivot to additional data by clicking on one on the named APs. This allows us to generate reports and explore an individual AP.
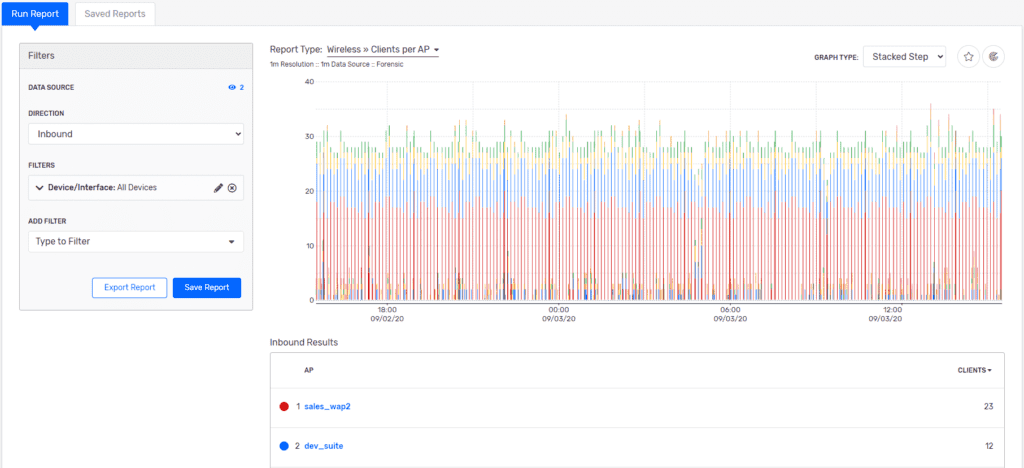
The Sales_Floor_WAP2 has the most client connections, so we’ll use it for this example. Clicking directly on the name opens the “Run a Report” menu option and we can pivot (this keeps us in the same data, timeframe, and flow period) to a custom report that shows us a source IP, source MAC, and the traffic volume for that time period.
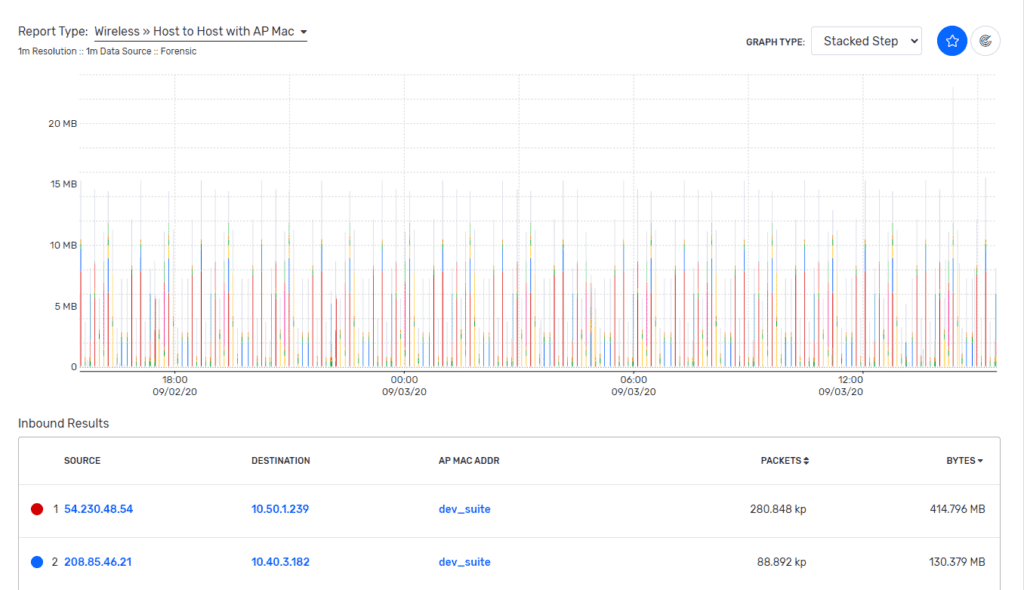
Now, why is this custom report so valuable? Because we have the key pieces of information that are shared fields across other exporters, this means we will see some of the same data appearing in flows being collected by other exporters — this is where we begin to enrich the wireless impression tracking data. Timeframe, source MAC, and source IP are the three data points that will allow us to pivot from our Wi-Fi report into the enriched metadata that a FlowPro probe or a Gigamon App Intelligence deployment provides (especially useful in large areas like a conference floor, arena, or trade show).
It’s all about context
By filtering on the source MAC field, we can isolate the address (or addresses) that we want to further investigate. From there, it’s as simple as swapping out the exporting device to the probe or Gigamon view and then pivoting into the report with the data we want to see. We can even take this a step further beforehand if we have the list of MAC addresses. These can be labeled and imported so that when we report back, they show up with a custom heading.
RFID and Token ID will be integrated into the attendance tracking toolset, but pulling this information won’t come from the flows of the Wi-Fi infrastructure. Instead, we will make use of the API—importing this information into Scrutinizer as an IPFIX options template is something that will be HIGHLY valuable. This will help correlate those datapoints to the network activity, which will give a full picture of a user’s activity. Ask us about your platform of choice and we can figure out if exporting from your platform is supported.
Then you can begin to answer questions like:
- Did this user visit a sponsor site on any Wi-Fi endpoint (not just the one close to the booth)?
- Are there multiple devices using the same username/password to authenticate?
- Do we need to see past a CDN to understand where the end destination is?
If you offer event or network monitoring service plans and packages, predictable patterns ensure a high ROI and the most valuable thing you can offer to your customers is a guarantee and robust wireless impression tracking is paramount. This where the importance of monitoring and correlating your wireless network traffic will continue to add context for network, security, sales, and marketing teams. Know your data and know your customers with Plixer’s NTA Platform combo: Start a trial today and connect with us on LinkedIn.