Splunk
Support for Splunk and ElasticSearch is built into the core of the Scrutinizer system. When the flow data is displayed in the Splunk dashboard, richer details are only a click away. Drill in on IP addresses and start filtering by including and excluding details until the root cause of the problem is made clear.
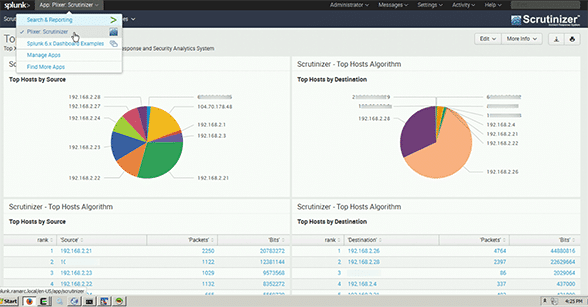
Scrutinizer is capable of collecting millions of flows per second and it can unify the flow exports from all of the network devices. It then makes them searchable through the Splunk dashboard.
Incredibly fast searching
Enter an IP address or a username and click “search.” Within a few seconds, Scrutinizer will find the device across dozens of collectors that could be receiving flows from tens of thousands of routers, switches,firewalls, and virtual servers. Drill in for details to determine who, what, when, where, and how much. Users always have the ability to jump back to Splunk to view the logs related to the host. It’s just a simple click to get back to the related data in the Splunk interface.
Scrutinizer and Splunk integration
In all organizations, catching security threats hidden within network traffic is vital to keeping the business running safely. But when your network grows and your main data analysis system isn’t optimized for gathering many types of data, it becomes much more difficult. Splunk users can use Scrutinizer alongside their solution, allowing for easier and faster data correlation with Plixer’s integration app.

Scrutinizer Plugin for Splunk
When greater context is needed, Scrutinizer can provide details on username, operating system, and more by integrating with 3rd-party authentication systems such as Microsoft Active Directory, Cisco ISE, and others. Network incident response with the right context is where Scrutinizer and Splunk deliver.
