The VMware DFW (Distributed Firewall) is part of the NSX feature set and provides a way to manage which connections are permitted or denied within a VMware Software-Defined Data Center (SDDC). The DFW is capable of even more, however, when configured to export IPFIX to a flow collector, like Scrutinizer, for analysis.
The IPFIX exports that you can get from the VMware DFW are similar to those you can get from a Cisco ASA in that the flow data can contain information on both denied and permitted flows. The DFW accomplishes this by tracking the states of flows—as the tracked flows change state, IPFIX can be used to export data about the status of that flow. States include flow creation, flow denial, flow update, and flow teardown.
This is valuable because it can be used to identify hosts that are trying to communicate to hosts and protocols that they should not be communicating with. It also allows administrators to understand which protocols are in use before implementing new policies.
Monitoring Flow Exports from Your VMware DFW
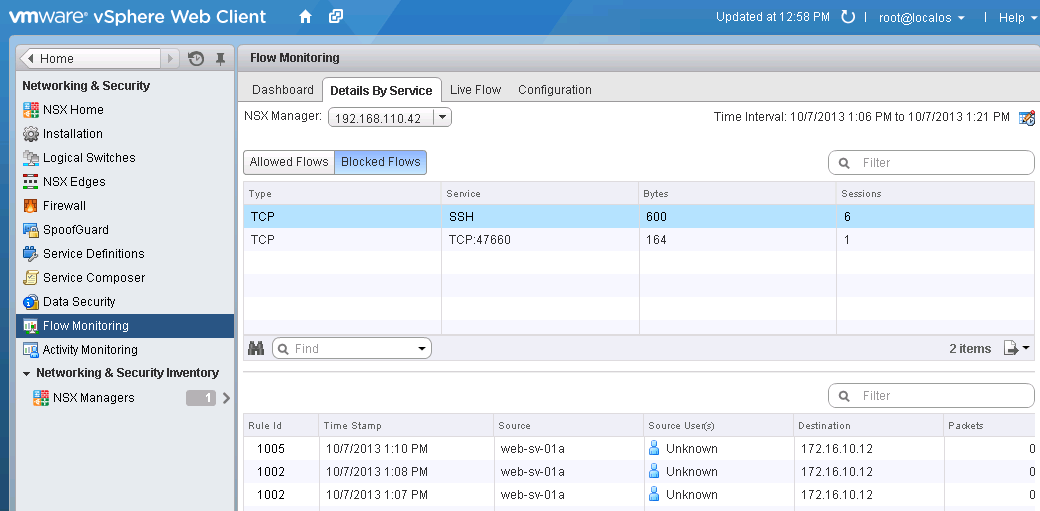
VMware NSX for vSphere provides a Flow Monitoring tool, as pictured below (image from the VMware blog):
In this image, the user has a “global view of all flows encountering firewall rules in the virtual network.” VMware also states that with the NSX’s adjacent position to applications in the virtual compute layer, it has full visibility of all flows. This flow data can be exported as IPFIX to a monitoring tool for analysis. Using an analyzer like Scrutinizer, the user can obtain a much wider breadth of information from the flow data that the DFW can pass along. The user also gains the ability to report and filter on metrics such as VXLAN tags, virtual tenant hosts, and port group ruleIDs.
Using these exports with Scrutinizer enables VMware users unprecedented visibility into what is happening in an SDDC. The ability to export this information gives NSX users more flexibility in reporting, data retention, event correlation, Network Behavior Analysis, and traffic capacity and bandwidth planning.
Enable IPFIX Exports on VMware DFW
The steps to enabling IPFIX on the VMware DFW, as outlined in one of our blogs last year, involve enabling Global Flow Collection and IPFIX flow export, as well as setting up IPFIX collectors.
- Navigate to NSX Home > Flow Monitoring, and click Enable for “Global Flow Collection Status”
- A new tab will appear for IPFIX
- Navigate to the IPFIX tab and then click Edit to enable IPFIX flow export
- Enter Observation DomainID (valid range 0 – 65535) and Active Flow Export Timeout (usually 1 minute), then click OK
- To add a new collector, click on the + symbol
- Provide the collector IP and UDP port number
- Click Publish Changes to bring it into effect immediately
That’s it, you’ve set up your DFW to export IPFIX to your flow collector.
To learn more about how Scrutinizer can be used in conjunction with the VMware DFW, contact us or download the Scrutinizer free trial.


