UPDATE: The information below applies to version 17.x of Scrutinizer. If you are on a recent
In a previous post, we described how you could add variables to the Scrutinizer URL to generate a report. Well, much has changed since 2013; in this post, I will explain how you can use URL-based reporting to view detailed network data.
Before I begin, I want to provide a scenario for those who might be wondering why you would need URL-base reporting.
The ability to report on and monitor network events is critical to any organization, and most organizations have more than one solution to monitor and manage their network. But while forensic data is critical to recovery and analysis, not all organizations view it as the go-to solution for network management. Your organization may have other solutions that you primarily use, but within which you would like to view detailed Scrutinizer reports. In this case, Scrutinizer acts as a Data Broker by providing you with the context-rich flows and metadata, but in a different interface.
By generating your report, and then viewing a set report in another application (via iFrame, etc.), you can have the best forensic and network monitoring solution data inside of your existing third-party network management solutions. Allow me a few more moments of your time to explain how to generate URL-based reports in Scrutinizer.
Creating a URL-based report
The first step to using URL-based reporting is to create/run a report (it can be a saved report, but it doesn’t need to be) from within Scrutinizer. Once you have the report created, select the “Report Details” button in the side panel in Scrutinizer.

When the details modal opens, select the “Report JSON (API)” tab in the upper-right section of the modal.

The default view of the JSON dataset is Indented. After all, many of us prefer to visualize cleaned up JSON datasets—unless you’re the type to write programs all on one line. In that case, I stand corrected.
Select the “Collapsed” radio button, then select and copy the JSON information.

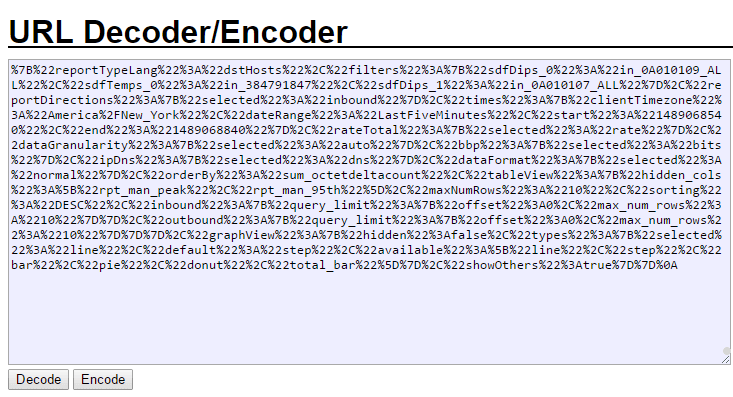
Now that you’ve copied the report JSON, paste it into your favorite URL Encoder. I like the meyerweb.com encoder, but I’ve heard good things about Dan’s Tools url-encoder-decoder.com. Once you’ve encoded the JSON dataset, you should end up with something like this:

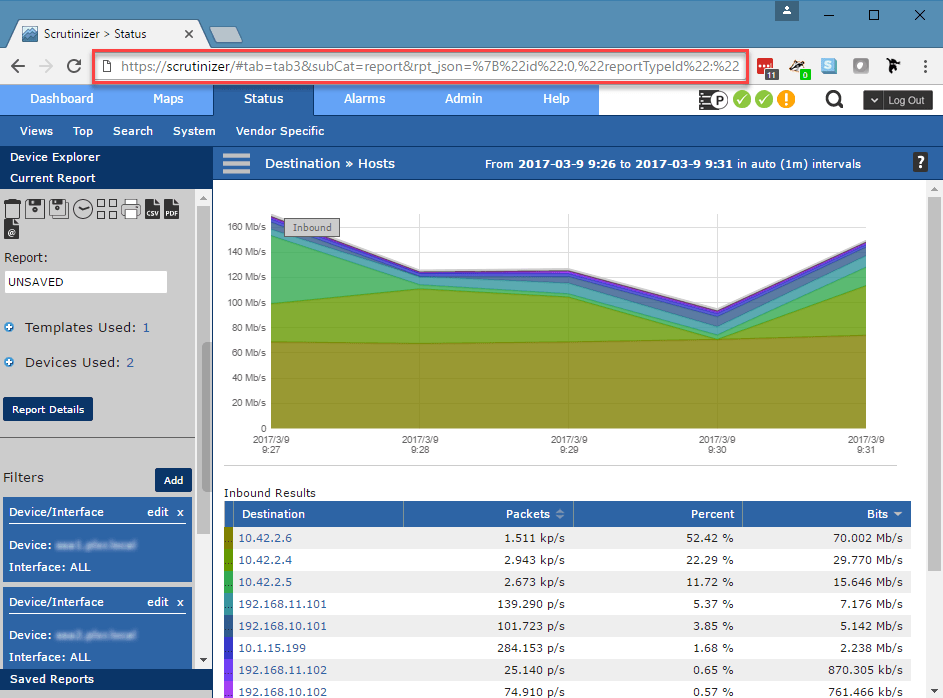
Copy the encoded JSON and put it into the Scrutinizer URL as follows:
https://SCRUTINIZER_SERVER_DOMAIN/#tab=tab3&subCat=report&rpt_json=ENCODED_JSON_DATASET_GOES_HERE

If you load the URL from a third-party application, or simply in your browser, you’ll be able to see the report that you previously created.

By taking advantage of the URL-based reporting functionality in Scrutinizer, you can leverage the rich data Scrutinizer provides, while continuing to use your other tools as the single pane of glass for network monitoring and management. Below is a video of the process (thank you Dev team) to help you visualize how to get the url-based report in place.
If you have any questions about using our API or setting up URL-based reporting, please reach out to our technical support team; they would be more than willing to help.


