I talk to customers daily about forensic data granularity as it relates to collecting and reporting on NetFlow exports. I am often asked about how we store data and what is the resource impact on collecting flow data.
What is Data Granularity?
Data granularity is the level of depth represented by the data collected. High granularity means that you get a minute by minute detail accounting level of the transactions traversing the network. Lower granularity zooms out into more of a summary view of the data and transactions.
Why is this important?
When it comes to network security and incident response, how the data is stored, how long the data is stored, and how the data is presented, ultimately makes the difference when it comes to understanding the traffic traversing the network.
Being able to configure how the flow data is stored on both a granularity and trend level is very important because when security professionals need to go back in time and view a communication pattern, they need to be able to find the flows that contain the conversations that they want to investigate.
From a compliance standpoint, being able to adjust the granularity at all trend levels is key. It is one thing to be able to see high traffic details occurring over the last few minutes. But to be able to maintain that level of visibility over long trends allows administrators to verify compliance at any time over any time frame.
How do we do it?
The flexible data history settings allow you to customize the storage patterns in the database based on the granular NetFlow reporting requirements you have, and your available disk storage resources.
Raw data is each and every flow exported from the monitored interfaces of the routers. All of the flows exported from the routers are stored in the database as raw data in 1 minute data tables. Since, the 1 minute tables include each and every flow from the routers, the 1 minute granularity provides the most detailed analysis of the traffic. But, they can consume a lot of disk space.
The 1 minute storage is determined by the Data History settings. One minute, as well as all of the data storage time intervals, can be configured by clicking on Admin Tab–> Settings –> Data History.

It is at this level that all of the security algorithms are run, providing a very proactive layer of security monitoring looking into all of the flows.
Apart from the raw data storage, Scrutinizer stores aggregated data in the database at different time intervals. The aggregation mechanism (roll ups) happen simultaneously at the back-end along with the raw data storage. The aggregated data is stored based on the Max Conversation setting of the application which can also be configured by clicking on Admin Tab–> Settings –> Data History.
The aggregation of flow data collected is done to avoid high disk space usage without impacting reporting and performance. The aggregated data is generally used for historical reporting, capacity planning and trend analysis.
Older data is repeatedly rolled up into less granular times (5 minute, 30 minute, 2 hour, 12 hour, 1 day and weekly). The Max Conversation value determines the top number of records for every flow template type found for each device, based on octet value, that are aggregated and rolled up to the next time interval.
We update 5 minute tables every five minutes. We select the conversations over the last five minutes from the 1 minute tables, aggregate like flows together, then roll up the top flows based on byte count, per device, per template using the Max Conversation value.
We update a 30 minute table in the same manner. We select flows that took place over the last 30 minutes from the latest 5 minute table, aggregate them together, then roll them up. This process is repeated through all of the time intervals.
Now that we know how the data is stored, let’s take a look at how the data is presented.
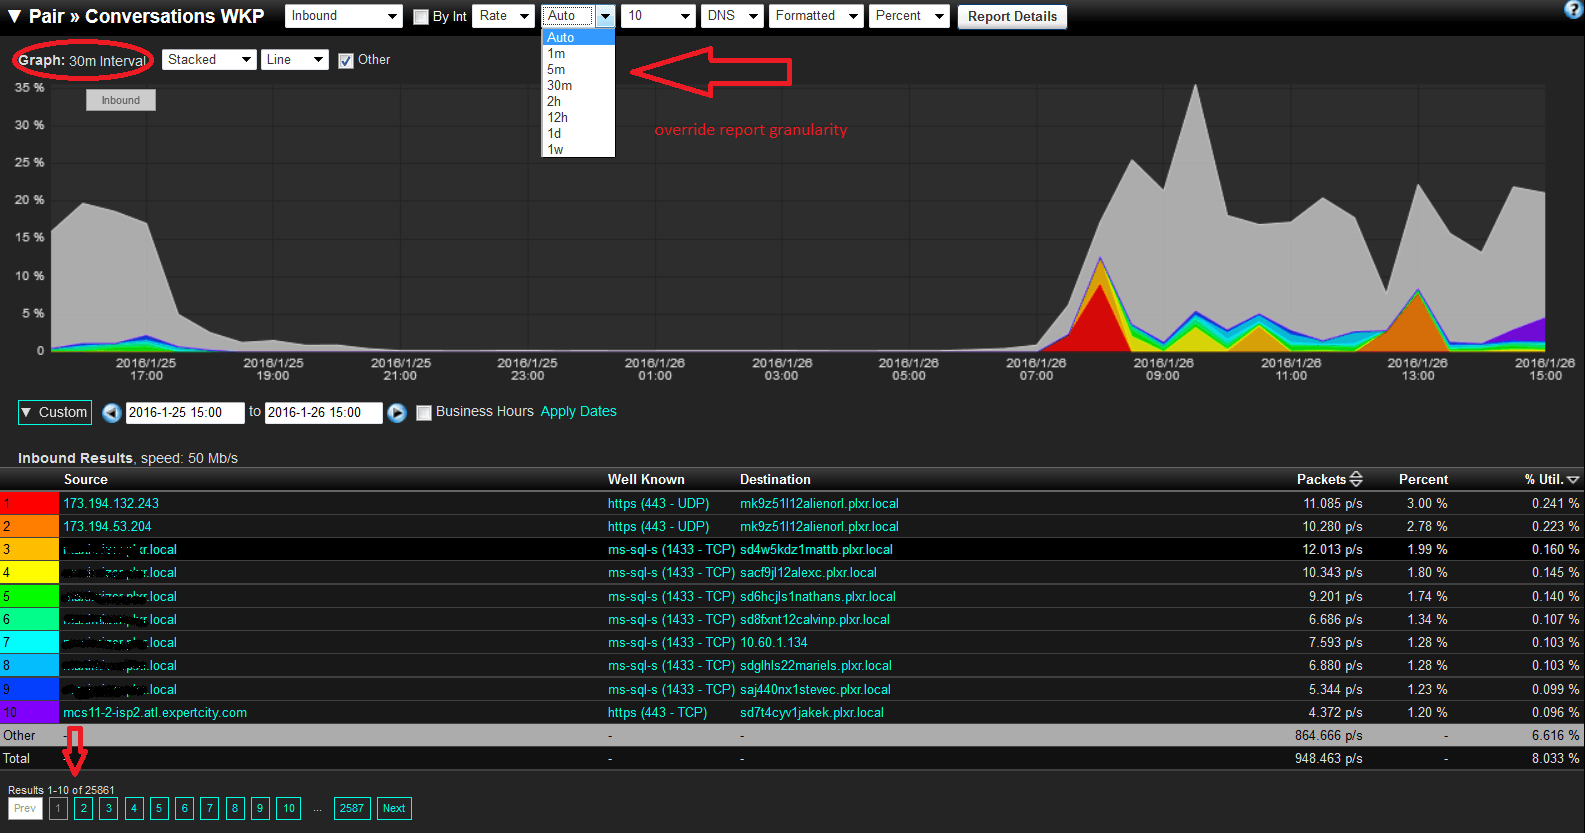
When creating a report, the time interval used when displaying the report is automatically determined based on the date/time range specified in the report filter.
Note the report opens initially using the Auto setting in the Granularity Box of this 24 hour report filter, and opens in 30 minute data intervals. Also notice that this report page is showing 1 through 10 of 25,861 conversation line items. That is the max conversation function maintaining data granularity across the rolled up data.

But if you need a more granular view, notice the option to select a value in the granularity box other than Auto.
The bottom line when it comes to network traffic visibility and protecting against cyber attacks, is that you need configurable options that let you determine how you store the flow data, and how granular you can analyze the data.


