
With the dramatic shift to work from home, Plixer has been working with people all over the globe to visualize VPN traffic in a variety of different ways. I wanted to take some time to capture what the top five most common use cases I have been asked for are along with some examples of what the reports look like.
1. Visualizing non-split VPN traffic
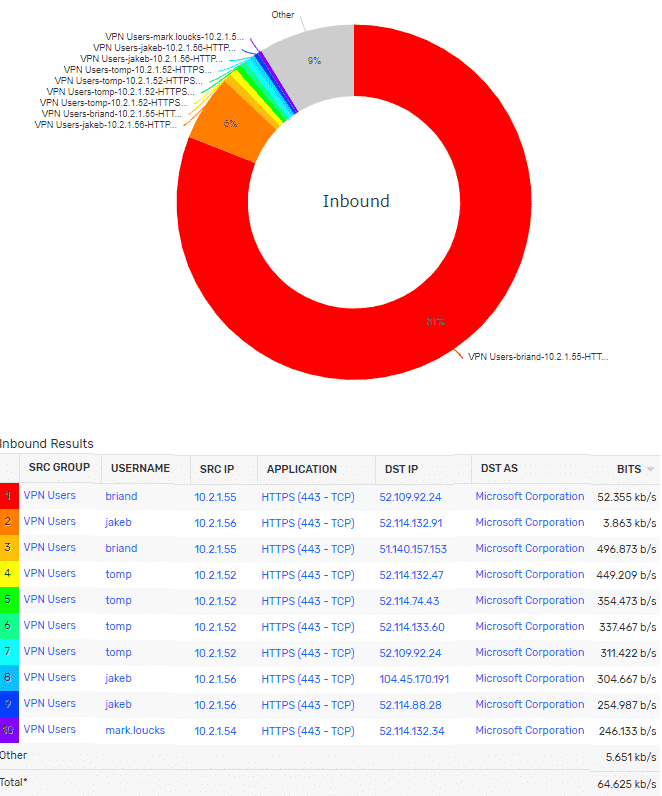
Building reports that compare internet-bound traffic vs. internal traffic on the VPN is far and away the most common use case I’ve been asked to help. Understanding which applications are driving the VPN is critical in preparing for the long-term support of remote employees. In the below image, all of the external VPN traffic is heading to Microsoft for services like Teams and Office 365. If this traffic was comprised of Netflix, Hulu, or other streaming services, we would want to be sure we are handling that traffic accordingly—either through company policy or perhaps by implementing a split tunnel.
2. Associating a VPN user IP address to a username
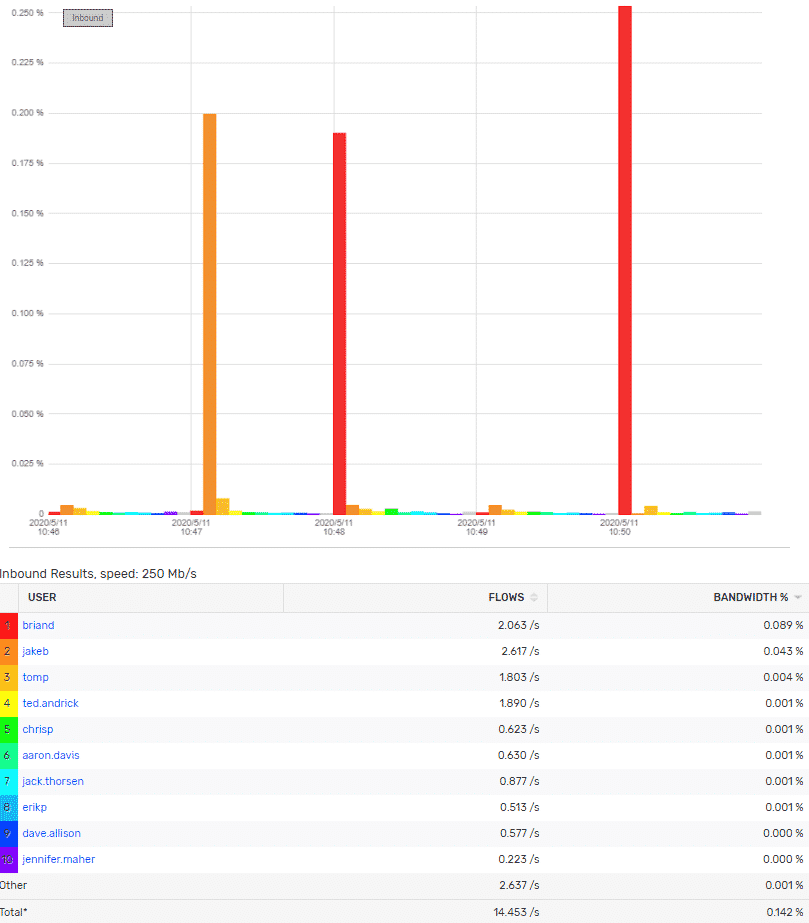
Customers who use a Cisco ASA as a VPN concentrator have a unique ability to correlate usernames with IP addresses for VPN traffic. The username field is sent in the teardown template from the ASA’s NSEL flow export and can be used to group traffic into a “Top Users” view like the one below, or simply for user attribution when needed.
3. Trending the number of users connected to the VPN
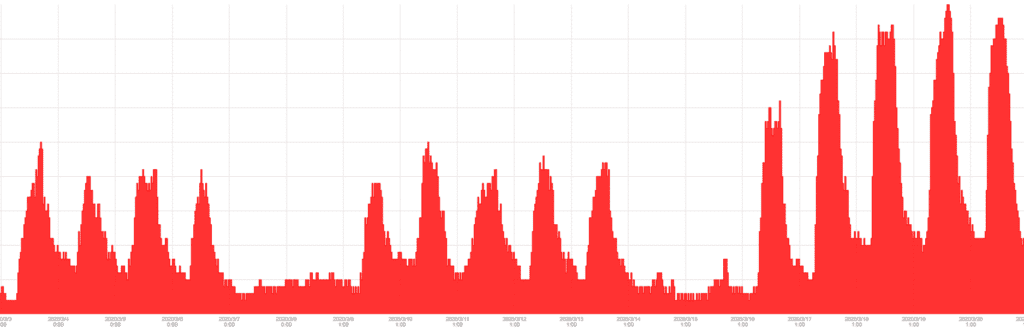
Simple time-series trends on the number of users connecting to the VPN help with capacity planning reports. A particularly interesting use case involves staggering employee work time to manage the number of people on the VPN at once. Another was to monitor the DHCP pools for VPN users to make sure they weren’t hitting the upper bounds.
I found it interesting to use this reporting to visualize exactly when Plixer went to a 100% remote workforce; note that the amount of VPN users almost doubles around 3/17/2020.
4. Monitoring critical corporate resources
Customers who have implemented split-tunnel VPNs have needed to visualize who is accessing what resources. By combining data from VPN appliances with IP grouping, we can display which groups are hitting which corporate resources. This is useful data for network segmentation efforts as well as overall application performance.
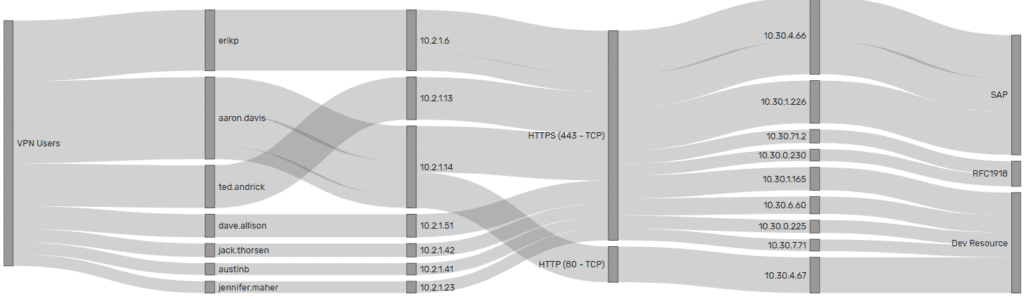
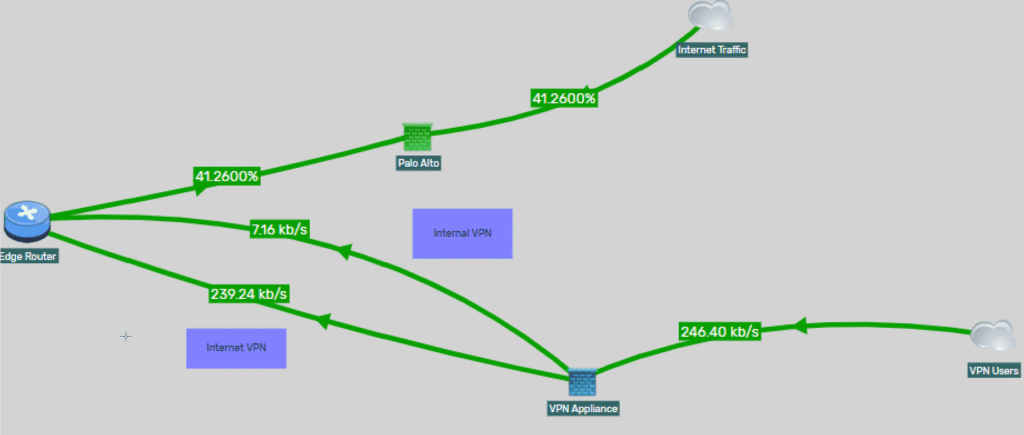
5. Creating maps to visualize traffic flow
In NOC/SOC-based environments, sometimes getting into the weeds of reporting isn’t as effective a nice map of the traffic. We have worked with countless customers to simple visualize how VPN traffic gets split between internal and external resources. There are thresholds set to change colors based on utilization percent with one-click visibility into the desired information.
Regardless of what your goals are for VPN monitoring, the ability to gather all of the data and visualize it in customizable ways is critical in achieving success. Please reach out to me directly if you would like any assistance in setting up reporting around VPN activity.