I’ve been working my way through some new Cisco NetFlow exports recently called ART which stands for Application Response Time. ART is part of Application Visibility and Control (AVC) and is an engine inside IOS that takes care of calculating application response time. AVC is also an umbrella term which includes performance monitoring.
The ART feature set falls under performance monitoring in IOS v15.4.1 and greater. Prior to this version ART fell under MACE (Measurement Aggregation and Correlation Engine). For those of you using IOS XE, ART metrics are under the performance monitoring feature set.
One of the things that ART does is monitor the flow in both directions. Because of this, “ingress” and “egress” flow monitors are both required on interfaces. The client and server response times are read from the TCP connection. The client is identified when it sends a packet with only a SYN flag set. The TCP flag handshake is how many of the metrics are calculated.
Below is a complete picture of how certain metrics are being determined. This technology creates a biflow where the direction is implied with the client being on the source interface. A flow exporting device (e.g. router) utilizes the TCP flags to determine several different time metrics – all of which are exported in NetFlow or IPFIX. The diagram below depicts where the time measurement metrics are taken.
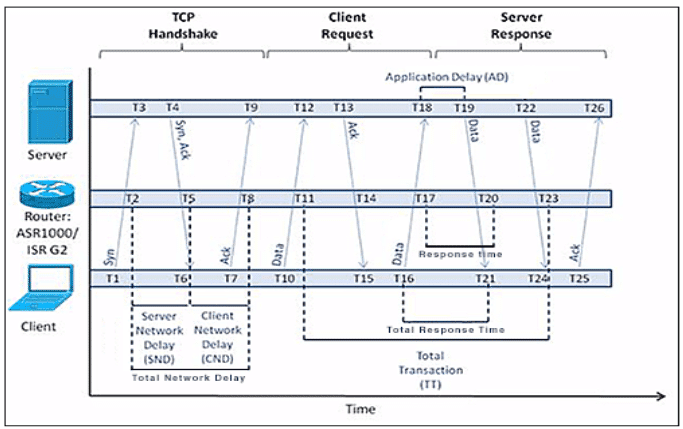
In reference to the above diagram, below lists several of the time metrics that Cisco is exporting in flows:
- Server ND: The server network delay is actually calculated first. The router notices a SYN and then sets a time that measures the time between the SYN from the client and the SYN ACK from the server. SND = T5 – T2
- Client ND: The client network delay is calculated when the router sets a timer after seeing a SYN ACK from the server. The router measures the time it takes for the client to respond with a ACK. CND = T8 – T5
- Network Delay: ND is known as round trip time (RTT) and is the summation of CND and SND. ND = T8 – T2. ND can also be calculated as SND + CND.
- Server Response Time: SRT is the time taken by the application to respond to a request. It is also known as Application Delay or Application Response Time. AD= RT – SND
- Response Time: The RT is the amount of time between a client request and the first server response. A client request can contain multiple packets. Often the last client packet received is the one used.
- Total Response Time Metric: Total time taken from the moment a client sends a request until the first response packet from the server is delivered to the client. It is also known as Total Delay (TD).
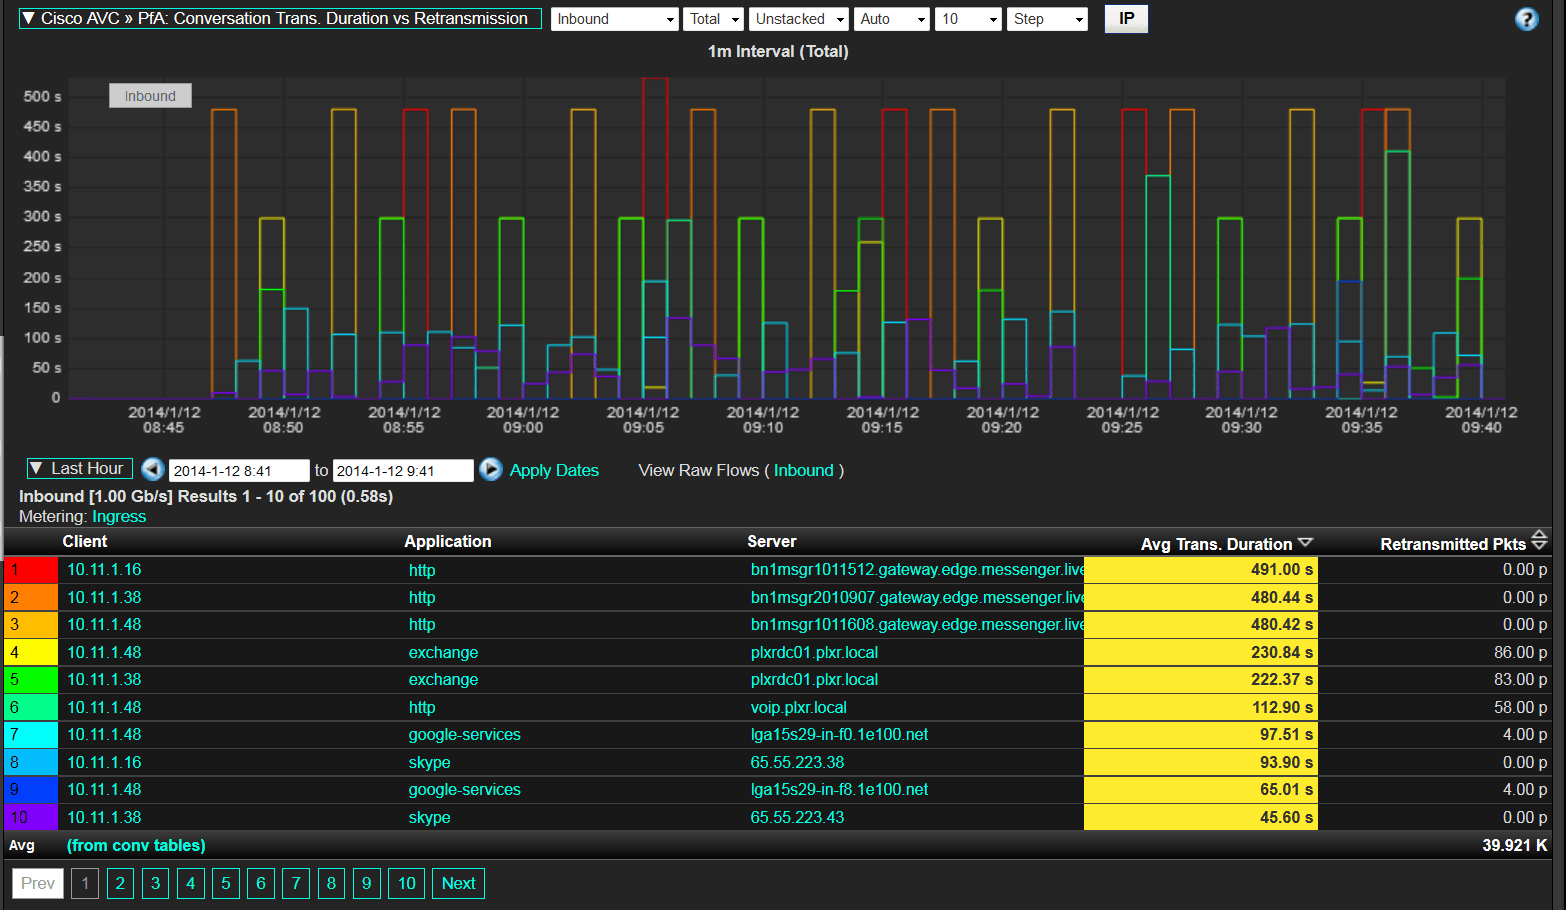
- Total Transaction Time: Amount of time between the client request and the final response packet from the server regarding a specific flow identified via the tuple. It is measured and exported on receiving either a new request from a client (which indicates the end of the current transaction) or the first FIN packet. This metric is shown below.
 The above is a report displaying information in a format that is extremely difficult with most packet analyzers. Many metrics like these are better measured with flow technologies. Here is an example Cisco IOS AVC configuration.
It should be noted that all of these different time metrics are not new to NetFlow and IPFIX. They have been exported by Cisco and other vendors for over two years. We can expect to see more vendors to follow.