The purpose of this blog is to de-mystify the hype around machine learning (ML) by exploring three topics:
- What kind of ML is Plixer using and why?
- What insights or predictions can be drawn out of NetFlow, IPFIX, and metadata?
- Once applied, how do the results reduce the strain on network and security operations teams?
Plixer Network Intelligence (PNI) is one of two ML engine licenses available for use with Plixer Scrutinizer, our network traffic analysis solution. Flow or metadata collected by Scrutinizer can be streamed to a separate ML Engine; it’s important to note that the ML Engine will also accept data streams from 3rd parties—more on that in a future blog. Network and security teams use the data collected by Scrutinizer to better understand the dynamic details of every conversation happening on the network in real time.
When it comes to traffic analysis, Scrutinizer is top of the class. With the addition of the ML Engine, the ability to profile traffic patterns, automate ticket creation, and proactively address network saturation are just a few of the key use cases that will be revolutionized.
The man behind the machine
Can your platform alert me when it sees anomalous traffic?
Yes of course it can!
Great! How does it differentiate between normal traffic and anomalous traffic?
Let me show you!
You may have asked this question of other vendors and not received anything concrete. It is hard to extract that kind of information accurately enough to use for proactive action. Companies pay top dollar for systems that can give them that edge, but getting those early warning systems up and running comes at a cost: a boatload of false positives and a ton of man-hours spent because the fundamental problem is still a lack of understanding when it comes to normal traffic patterns.
There are still bottlenecks because systems rely heavily on human input and direction before accurate identification begins to happen. Teams in charge of the day-to-day must define the normal boundaries, but what if those teams don’t know what normal should look like?
Think about the same problem within the context of these scenarios:
- As a SpaceX rocket returns to earth, specially tuned instruments monitor all aspects of the flight for deviations and then alert teams when something crosses the normal threshold—this is designed according to the laws of physics.
- A surgical assistant monitors vital signs recorded by different devices during surgery; those devices are configured around the average human body and can have their ranges manually adjusted depending on the patient.
- A home security system can record continuous video; to review that video we rely on software that identifies key information (person detected, noise detected, motion detected, etc.) because the average person doesn’t have enough time in the day to watch and accurately report on the contents of that video.
So to rephrase the problem, how do you take a mountain of data and synthesize it into a semi-self-regulating system of alerts?
The answer: K-Means clustering, Chebyshev’s inequality, and some very smart data scientists.
The machine behind the man
K-means clustering is an unsupervised machine learning algorithm that is particularly well suited for large datasets like NetFlow using data clusters. A cluster is a grouping of datapoints that have the shortest distance to a fixed point, called a centroid, and the strength of that cluster is based on both the distance and overlap compared to the other clusters created. The algorithm assesses training data and assigns each data entry to a cluster and those clusters are then used to assess the distance from the nearest centroid or mean.
For this application training data is run through a pipeline to create a feature vector that describes behavior over time. The number of features represents the number of dimensions the model will have. Think in terms of 3 dimensions like x,y,z but in this case the number of features is set to many more than 3 dimensions. More dimensions means much higher accuracy for the models and the subsequent alerts.
Arguably one of the most interesting aspects of the entire process is deriving the value for k, which tells the algorithm how many clusters it should use. Essentially the only input the algorithm needs (besides the training data) is k. There is an “optimal k” that can be found by running the same data through the algorithm, changing k, and then checking the accuracy of the results. The most accurate results mean the best value for k. This entire process is automated to ensure the models are using the proper number of clusters guaranteeing the best results.
Models are built and updated every day based on a point in time. The strength of a model can be assessed by observing the Variance, or the distance from other models, and the underlying clusters within that model. To measure the strength of the cluster data within a model we specifically focus on:
- Overlap, or the portions of the clusters that share data
- Density, or how close the data is the center of the cluster
A model will be reinforced up to five times to ensure only the strongest models make the cut.
A line crossed
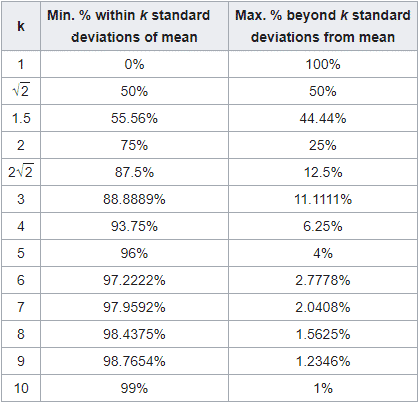
Now comes the most important part of the process: determining what both normal traffic and anomalous traffic are in relation to these models. To do this we use a theorem called Chebychev’s Inequality to establish the threshold. Why use this calculation? Simple: it allows the threshold sensitivity to be tuned and ensures the alarms that are generated are sensitive to standard deviations—i.e. it reduces the false positives significantly.
For each new piece of data that is run through the model, a cluster is returned that the data belongs to. A distance calculation is done to determine how far from the center the new piece of data is. If the new data’s distance is beyond the calculated threshold it generates an anomaly. I’m not about to try and explain all of the gritty details, but if you want to know more you can check out this piece on Chebychev’s Inequality for a deeper dive. We expose a “sensitivity” setting that adjusts the k variable referenced in the algorithms, see the table below for specifics on how the formula and deviation play a role in adjusting the sensitivity.

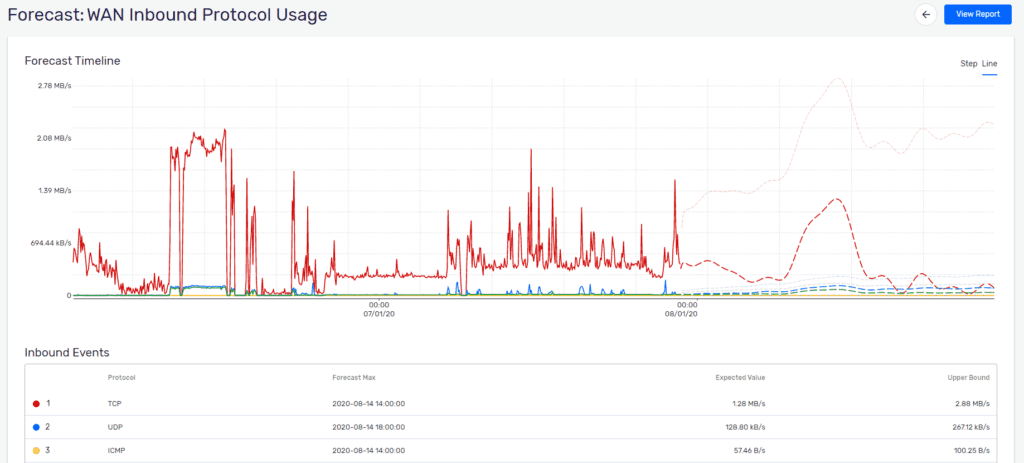
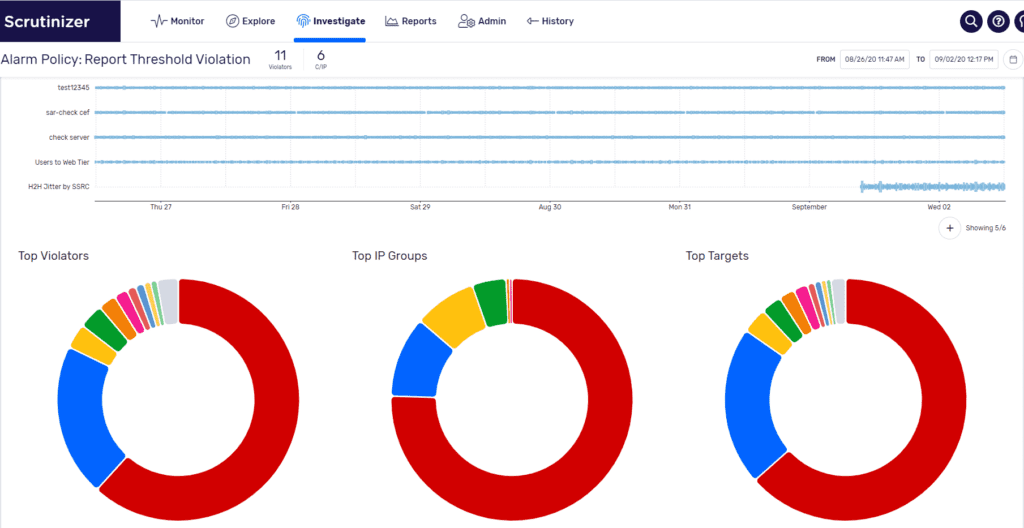
Now what else does the ML Engine mean for Scrutinizer? Forecasting. This highly anticipated feature set of machine learning allows Scrutinizer to alarm on long-term traffic utilization patterns to identify resource utilization changes long before they cause any impact. Adam Howarth, the brains behind that portion of the architecture, has provided an in-depth look of how forecasting with machine learning works and I would highly recommend reading that as well. They say a picture is worth 1,000 words so inquire about a demo today and let Plixer help you forecast and alarm on network deviations like the ones shown below.


