Application Performance Monitoring needs to evolve from a Network Map to an Application Map. It is amazing to me that most companies do not have a map of the applications that their business depends on. When application performance is crawling, the network is often the first suspect. I think the reason for this is partially because the network is the only thing documented. Everyone knows that the network isn’t always at fault when it comes to poor application performance. Lets fix this perception problem by starting off where the existing documentation ends.
A few years ago, I was asked to perform a network investigation at a 25 Billion dollar company that had been suffering from an application performance problem for more than 90 days. A critical application was slow and I was brought in to work with a group to solve it. I was teamed with some of the best; engineers representing IBM websphere, Sun Java and a couple network vendors. It was humbling to stand next to all this talent in the same room.
After I had listened for a while, I decided that in order to catch up with the others, I needed a high level view of the infrastructure. I asked a few questions:
- Can I see the Network map
- What is the application?
- What are the end users complaining about?
Heads were spinning. I was a bit surprised when I heard things like: Where do you start? It is the network right?!? These are the traps we fall into when we don’t have an application map.
Every day, 20 people met at 2pm without resolution to discuss the application performance monitoring issue. I was contracted for 2 weeks and after collecting data from the others, learning about the behavior of the application and taking a look at the traffic patterns, I was able to play a major role in resolving the issue in 48 hours. How did we solve the problem so quickly?
We all understand that businesses run on applications not the network. What I mean by this is that the network provides merely a transport and physical function. In the case above, there were redundant computer sites with expensive WAN connections. We saw excessive traffic between servers at opposing sites because the databases were out of sync causing a constant attempt to sync up.
Inside the packets, I saw “CN=SCHEMA – LDAP” which alluded to the sync problem. We shut the servers down, performed a full reload from a backup and then synced the databases. Problem solved.
To avoid problems like this in the future, I suggested to the team that we spend a day drawing out the traffic patterns to create an application map. It amazed us all that we were able to put over 20 boxes with their TCP and URL relationships on a 8×11 piece of paper. We even visually mapped out the transport of the application and we did it end to end. By laying the application map over the network map, we were able to traverse how a packet would navigate the maze of cables in the data room. Ideally, an application map is different from a network map for several reasons:
- Application maps are defined with connections representing only flows within the application
- The application latency experienced by the end users is visually represented
- When drilling in on a specific host, end to end visibility (i.e. router hop by hop) must be obtainable.
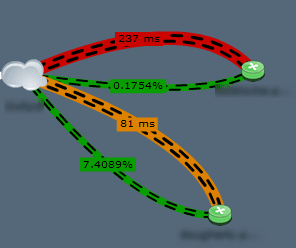
Above, we are able to layout the connections of the network as they pertain to the business critical application. This to me is an application map and the NetFlow exports used to gain these details are available in Cisco Application Visibility and Control Flexible NetFlow exports.
We all know that it isn’t always the network – it’s really about the business application performance as it runs over the network. Application Performance Monitoring can be greatly enhanced with the aid of a application map. Make sure your network map or maps include an application map for each business application. To do this, your network traffic monitoring solution should allow you to make network connections that reflect application performance and not just all network traffic. In a sense, this allows you to “Open your eyes and see what is in the cable”.