
In the IT space we are not new to challenges. Some might even say we welcome them and thrive in overcoming hurdles. Each and every department in our IT infrastructure faces their own unique challenges every day. Today I wanted to explore one challenge in particular: data silos.
What is the data silo problem?
At a rudimentary level, a data silo is a separate database or set of data that is not part of an organization’s enterprise-wide data administration. More specifically to the NetOps and SecOps teams, this generally means separate tools and data sets to accomplish department-specific tasks. More often than not, these separate databases contain duplicate information. Harvard Business Review has a great article on breaking down data silos.
Among storage costs concerned with housing the same data in multiple databases, there is also a time consumption cost with maintaining separate tools, renewing maintenance on each individually and training current and new team members. Now, of course there are use cases that present a need for separate tools, primarily in collection of separate protocols (i.e. syslog versus IPFIX data). But today, I wanted to focus on one protocol, IPFIX, and how a single tool like Scrutinizer can provide value to multiple teams. Let’s dig in!
NetOps
The NetFlow protocol has been around for more than 20 years and is widely adopted by many organizations world-wide. Traditionally NetFlow has aimed to answer the question “what’s eating up my bandwidth?” But the scope of what’s exported in flows today has vastly changed thanks to IPFIX and Flexible NetFlow. Now vendors have opened the door for us to choose which information elements are contained within a flow record. With this improvement, flow collectors can now collect, trend and alert on performance-centric elements like packet loss, latency metrics per conversation, layer 7 application tagging, jitter statements for VoIP calls, QoS and DSCP markings, SDWAN environment route changes and a lot more! Also, contained within the same IPFIX record are great information elements for security analysts such as DNS reply codes, TCP flags, URL strings, SSL version details, operating system, browser details and more. Why keep such rich details in a data silo, when it can provide deep insight into a variety of departments?
Let’s take a look at a few hypothetical scenarios where NetOps teams leverage IPFIX data.
Most commonly, it’s as simple as what’s eating up a particular link. IPFIX easily answers this question both on the fly and historically. Here, I have an alert configured for any interface exceeding 80% utilization. I’m quickly alerted that our WAN interface is seeing 82% utilization egressing out of the network.
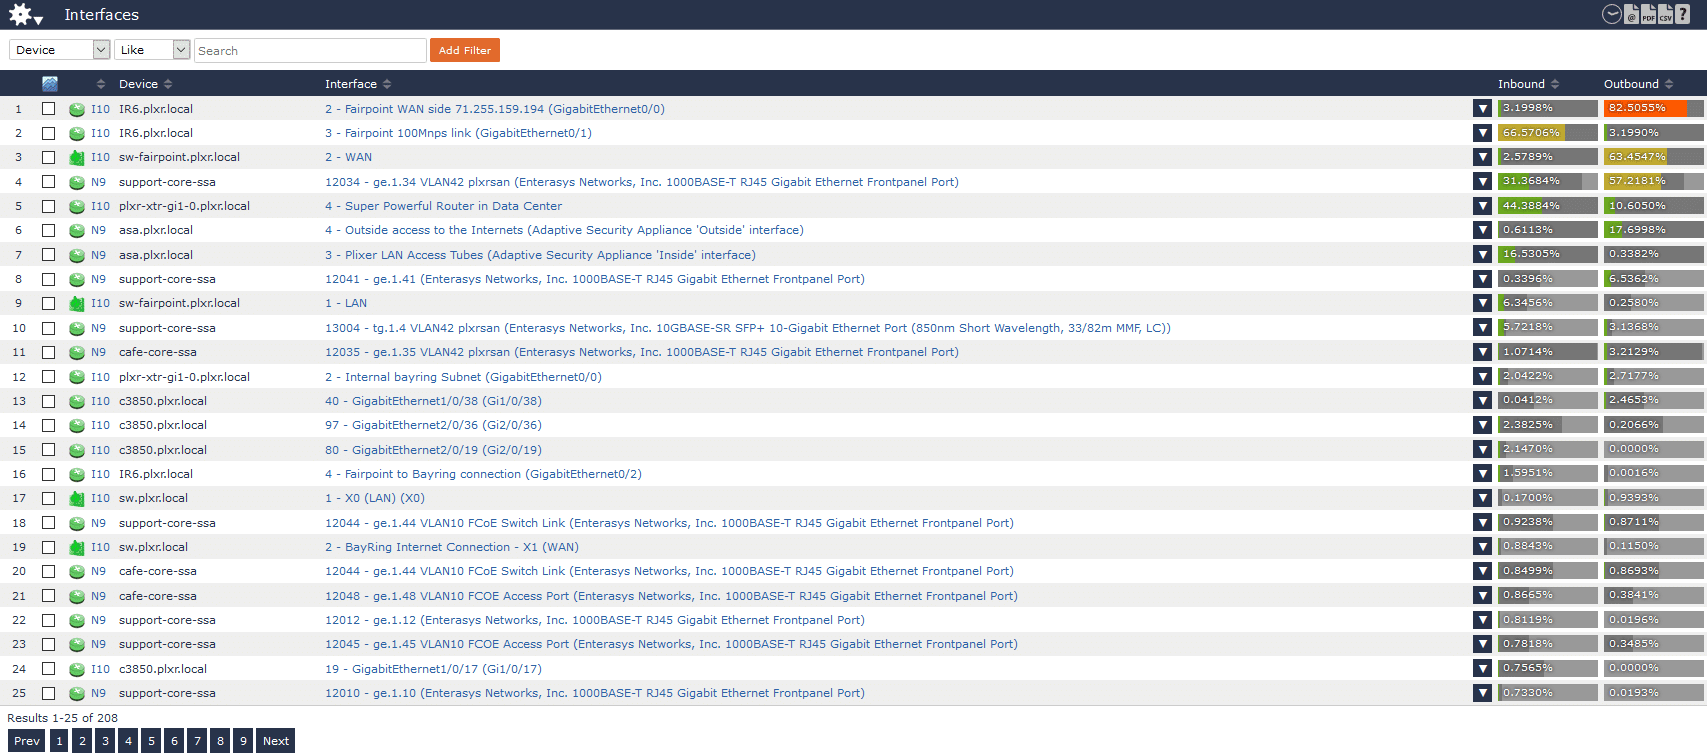
Determining what’s causing the spike in traffic is as easy as two clicks.
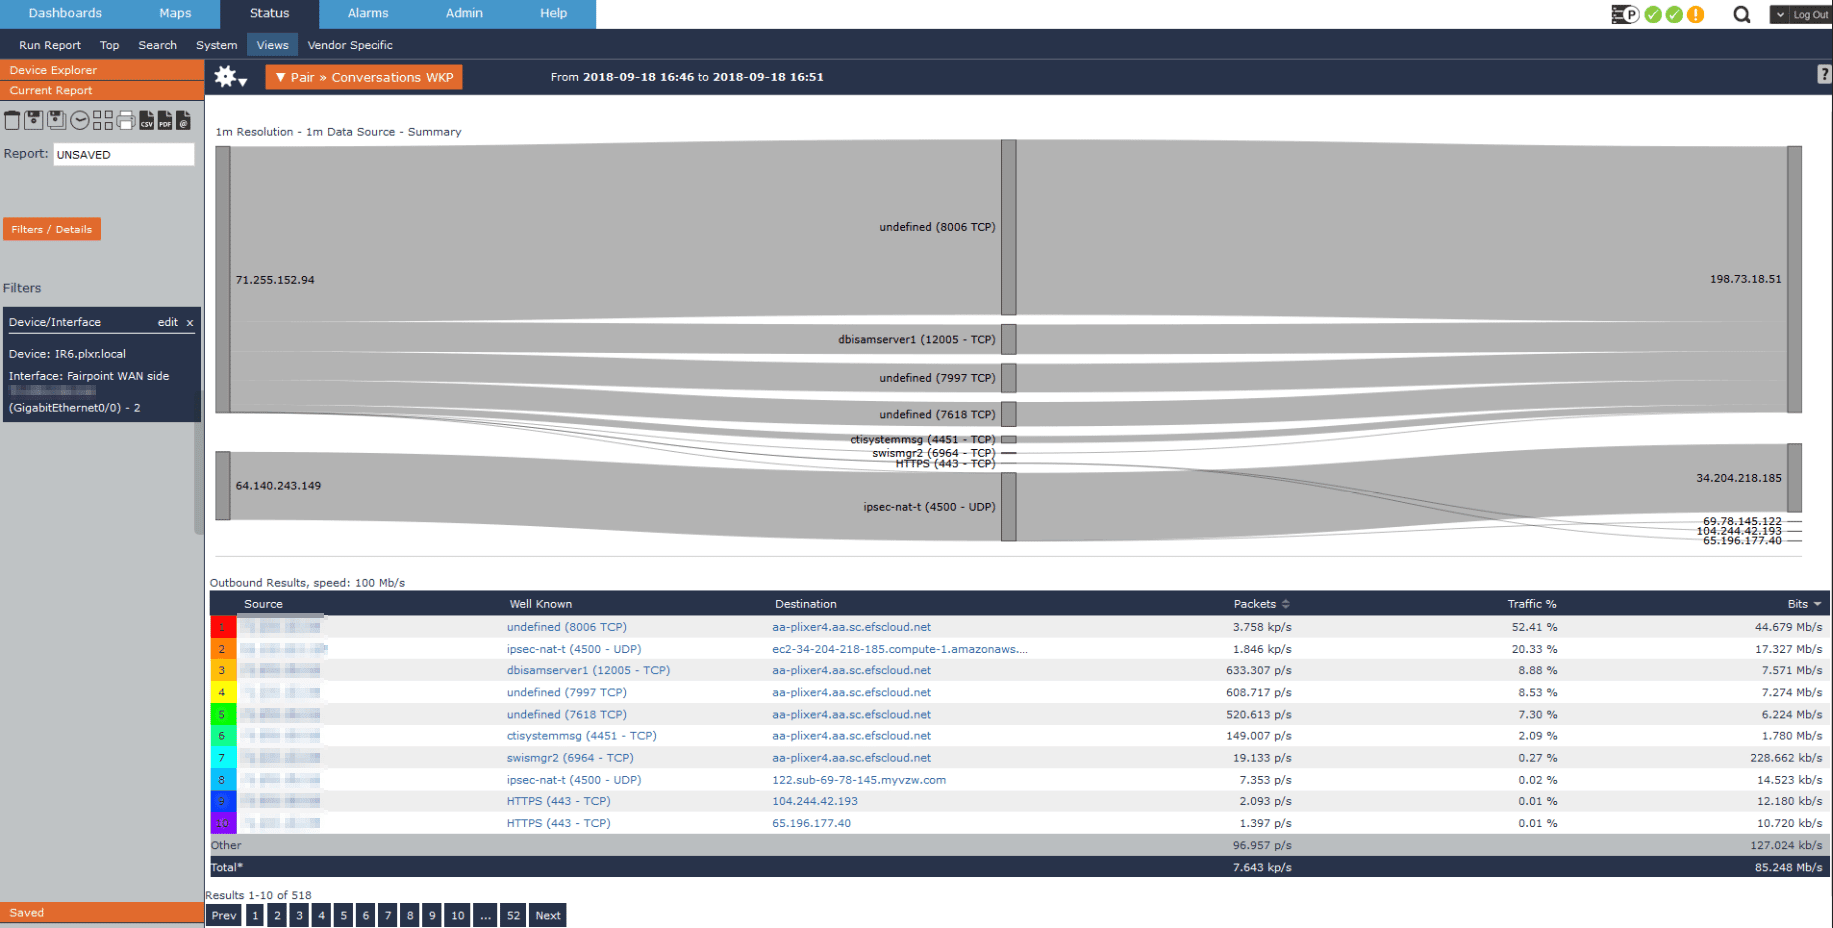
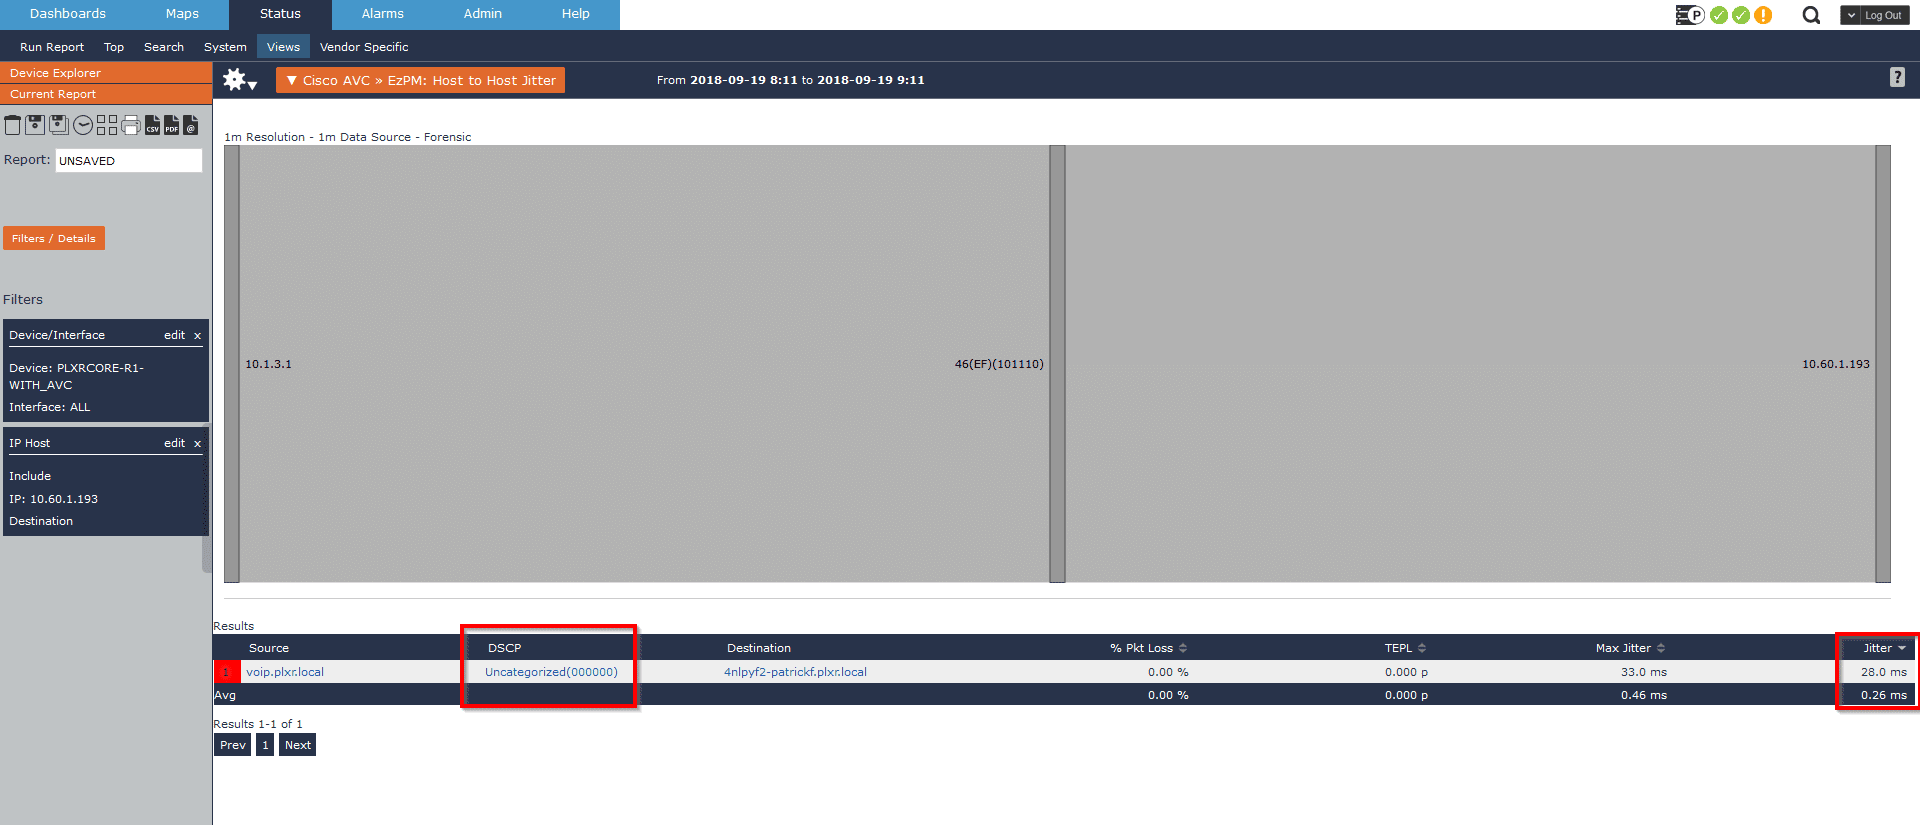
Another common use case is monitoring jitter statements for our VoIP traffic. In this example I’ll not only show how we can report on conversations with high jitter, but also how we can proactively monitor excessive jitter and begin troubleshooting before we get phone complaints from our end users.
In this example we have a user who complained about poor call quality around 11:30AM. Using Scrutinizer I can quickly isolate that host’s VoIP traffic and confirm that are exceeding an acceptable amount of jitter, but why? Fortunately, we’re also collecting the DSCP marking for each conversation and I can quickly recognize that this call is not receiving the correct priority within our network!
SecOps
In the SecOps world, an IPFIX collector is often underrated as far as the information it can provide. I’ve seen a growing trend from security professionals adding a NetFlow or IPFIX collector to their arsenal of tools. Unfortunately, when our organization is compartmentalized in a data silo, this more often than not results in two separate collectors: one for NetOps and one for SecOps. Often you’ll even find that the collectors in use will be strictly security functionality or strictly performance monitoring, but rarely both.
Scrutinizer can help bridge that data silo gap. As we saw above, Scrutinizer can definitely help uncover performance-related issues within the network, but it also has a suite of algorithms that monitor for specific attack vectors and alert the SecOps team to the suspect behavior.
In this first use case, I’d like to take a look at a high ranking concern of the SecOps team, monitoring for a compromised host. Here, we received an alarm that we have a host possibly trying to beacon to a command and control server.
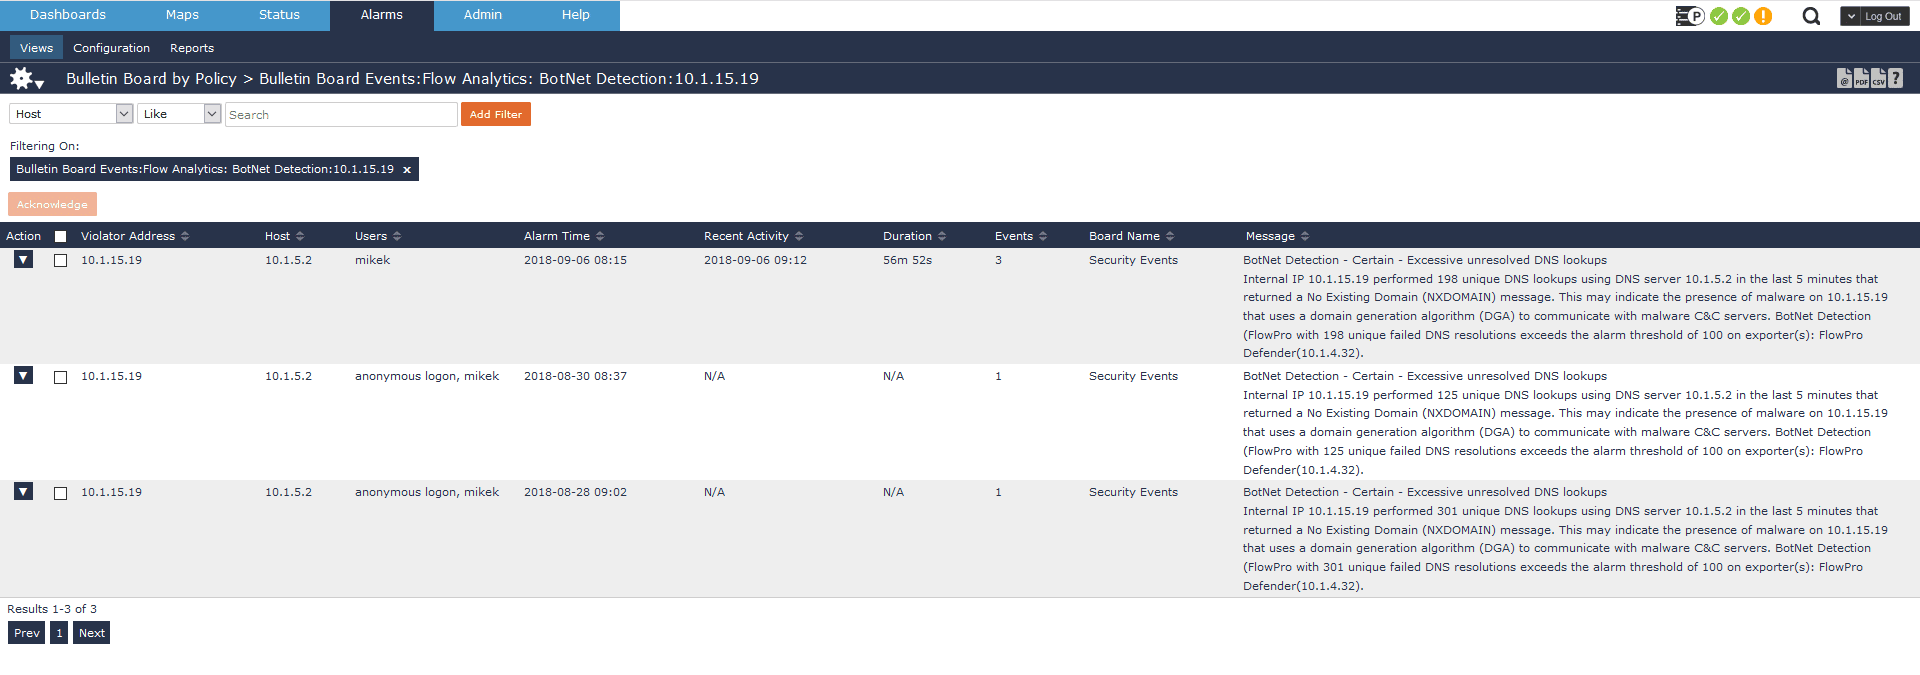
This example outlines a common practice for malware writers. They’ll use a domain generation algorithm to constantly ping out to nonexistent domains. Eventually this bad actor will get ahead of the algorithm and register one of the domains. When the compromised host beacons to one of these domains, a connection will be established. This particular alarm is telling me that on three separate occasions, a host in our network has made over 100 lookups returning an NXDOMAIN. It is possible this person fat-fingered google.com over 100 times, but not very likely.
In this particular scenario, I can drill in and find the 3rd-level domain involved in these lookups, which helps me determine that this is benign behavior.
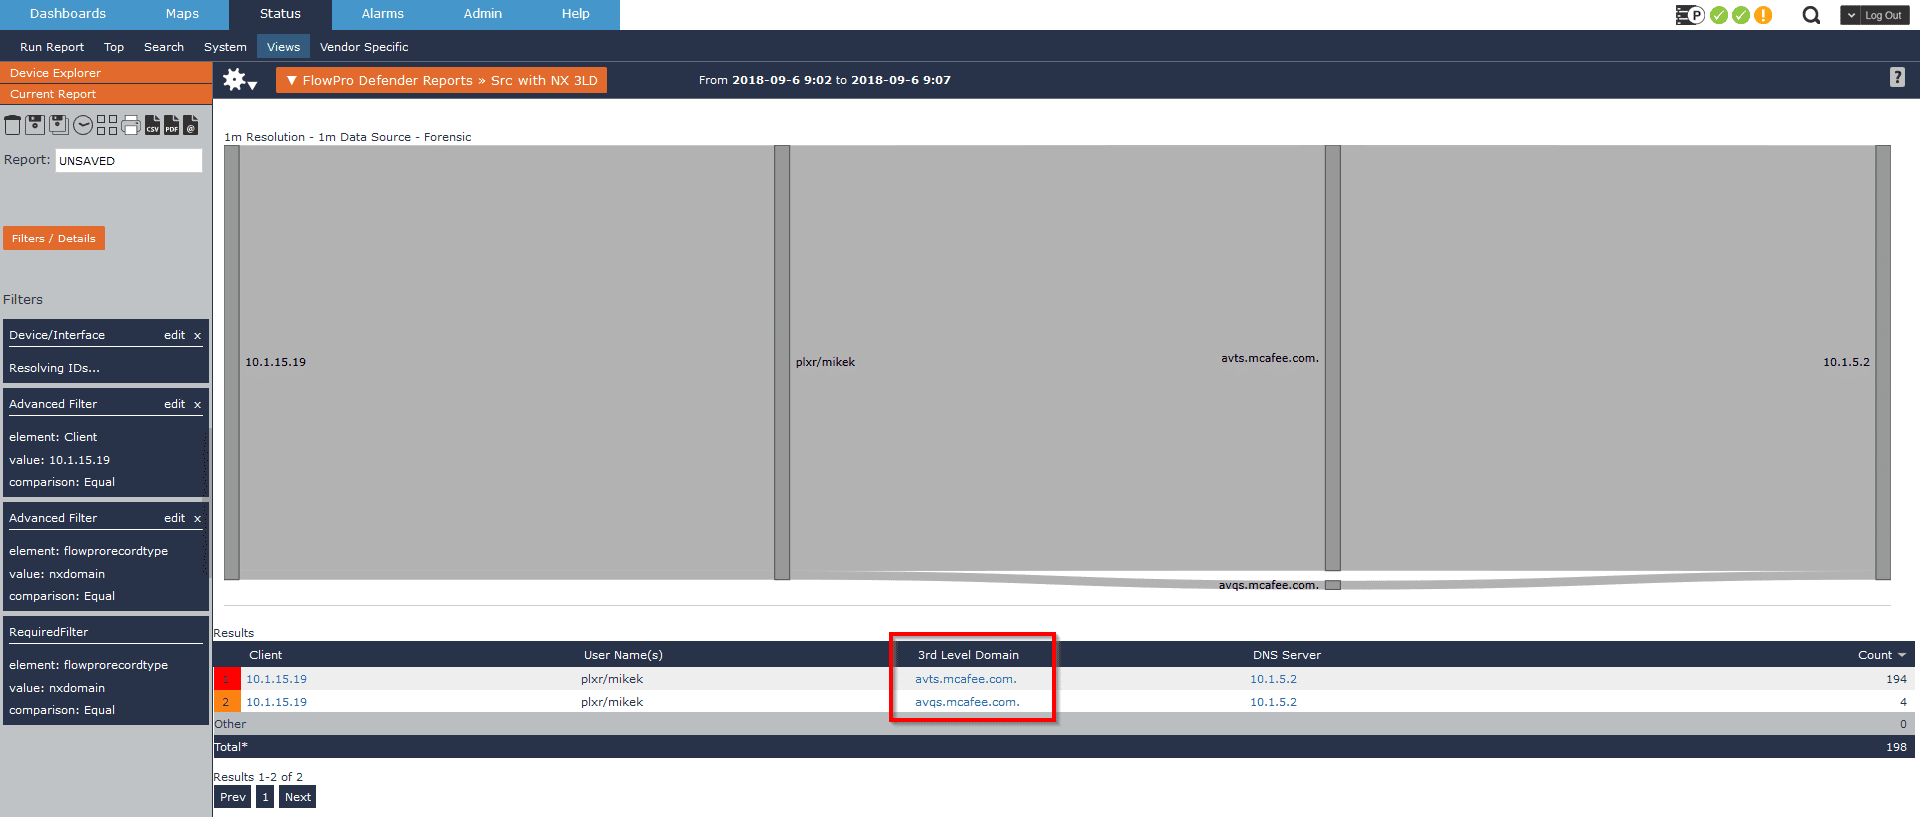
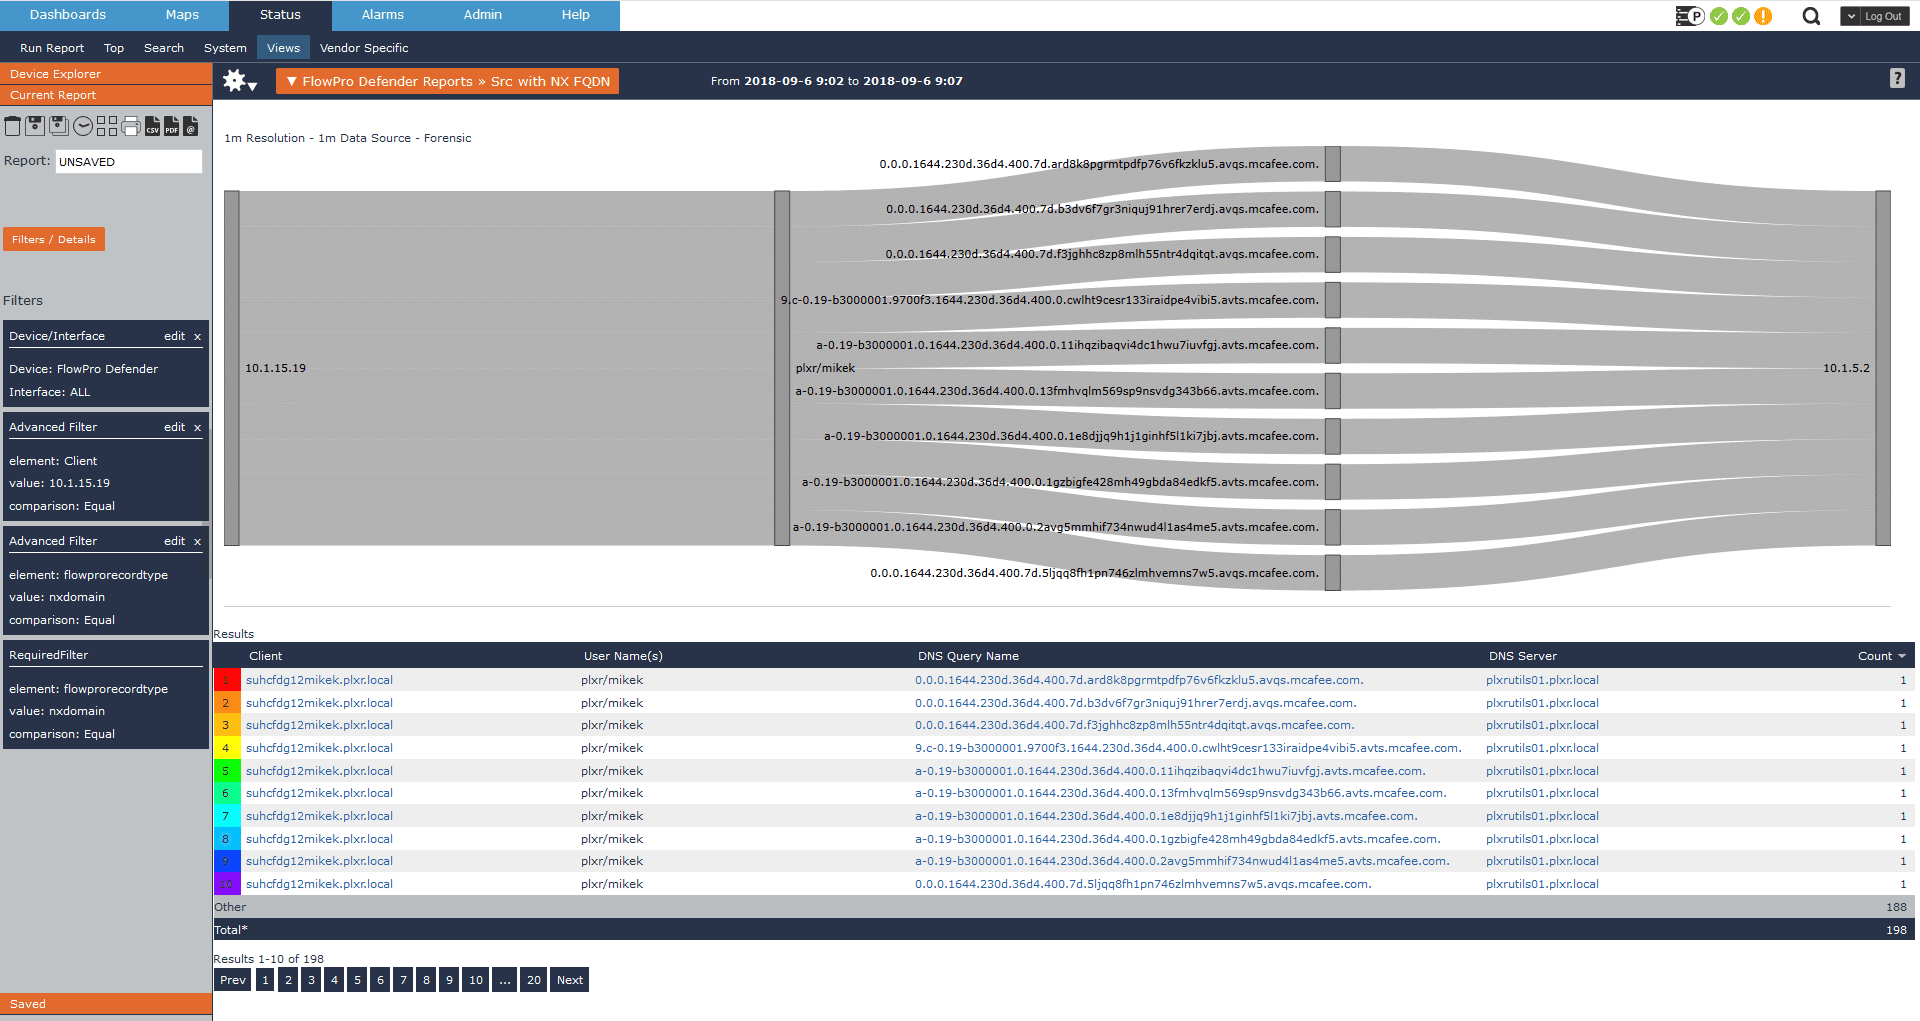
Here we can see the NX replies are coming from McAfee’s domain. From past experience I can assume this is expected traffic, as this is how most AV software phones home. To confirm that behavior, I drill a bit deeper and find the full query name tied to these NX replies, verifying that this is indeed expected.
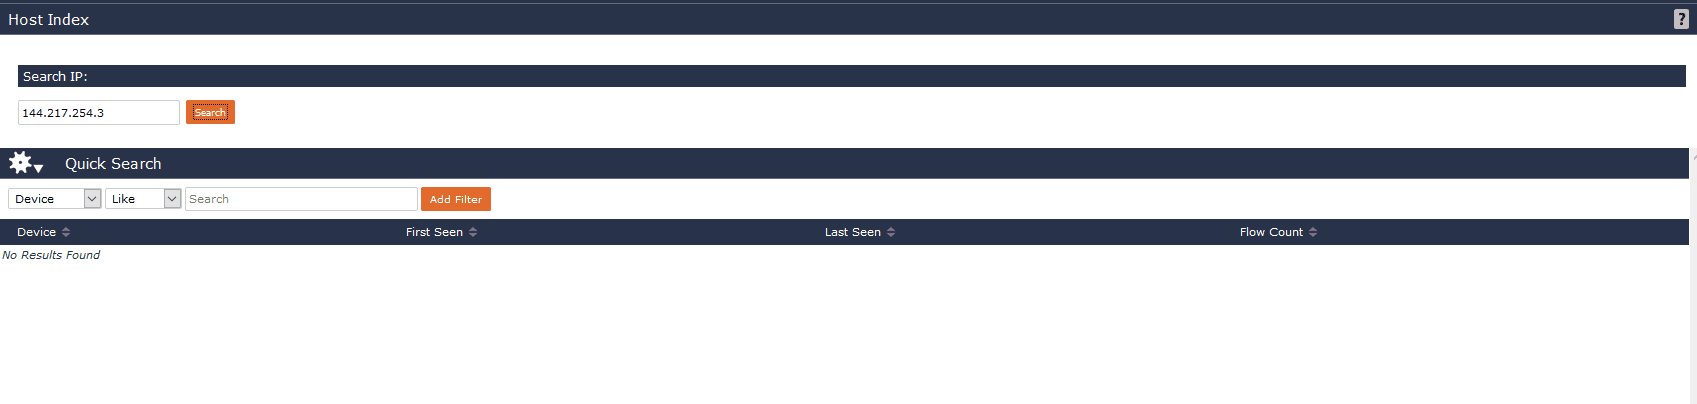
Another simple, yet extremely common use case leveraging IPFIX data is what we call host indexing. Host indexing is a feature within Scrutinizer that allows me to verify if a specific host has ever communicated on our network.
While flow data is a lightweight protocol that can be stored for very long periods of time, nothing is forever. Eventually, to save our disk from filling we’ll have to expire older data. By creating a separate table in the database, we can store a running log of every IP we’ve ever seen communicating on the network. A fairly recent example of how this can provide value is the Wannacry ransomware variant. Embedded within the ransomware was a killswitch. Similar to the previous use case, a compromised host will continuously reach out to these IPs, acting as a killswitch. If a connection is established, propagation will cease. With the host index feature, SecOps teams can drop in one of the following IPs to verify if any internal host has attempted to reach out.
- 217.254.3
- 217.74.156
- 168.221.43
- 182.141.137
- 182.172.139
- 57.88.48
- 153.0.145
- 137.66.14
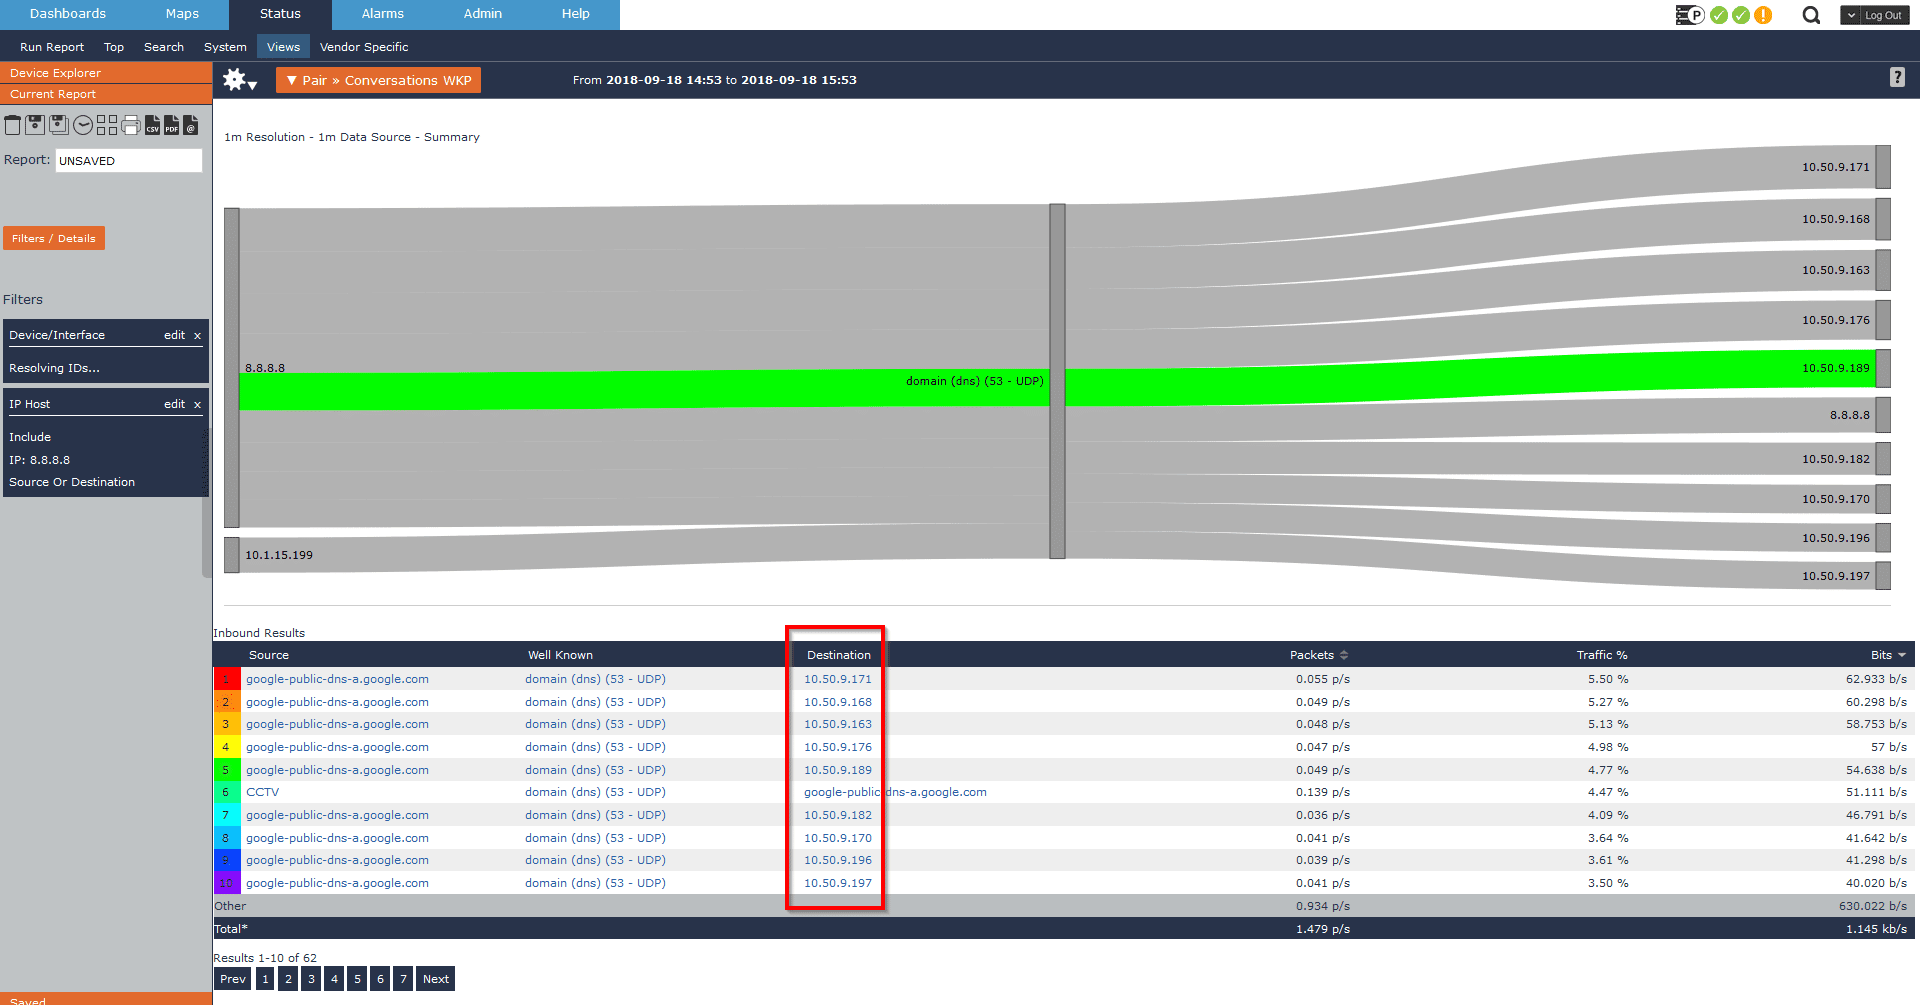
In these use cases, the ideal outcome is to return no results. As an example, I’ll use the same use case to see if we have any internal hosts reaching out to Google’s public DNS.
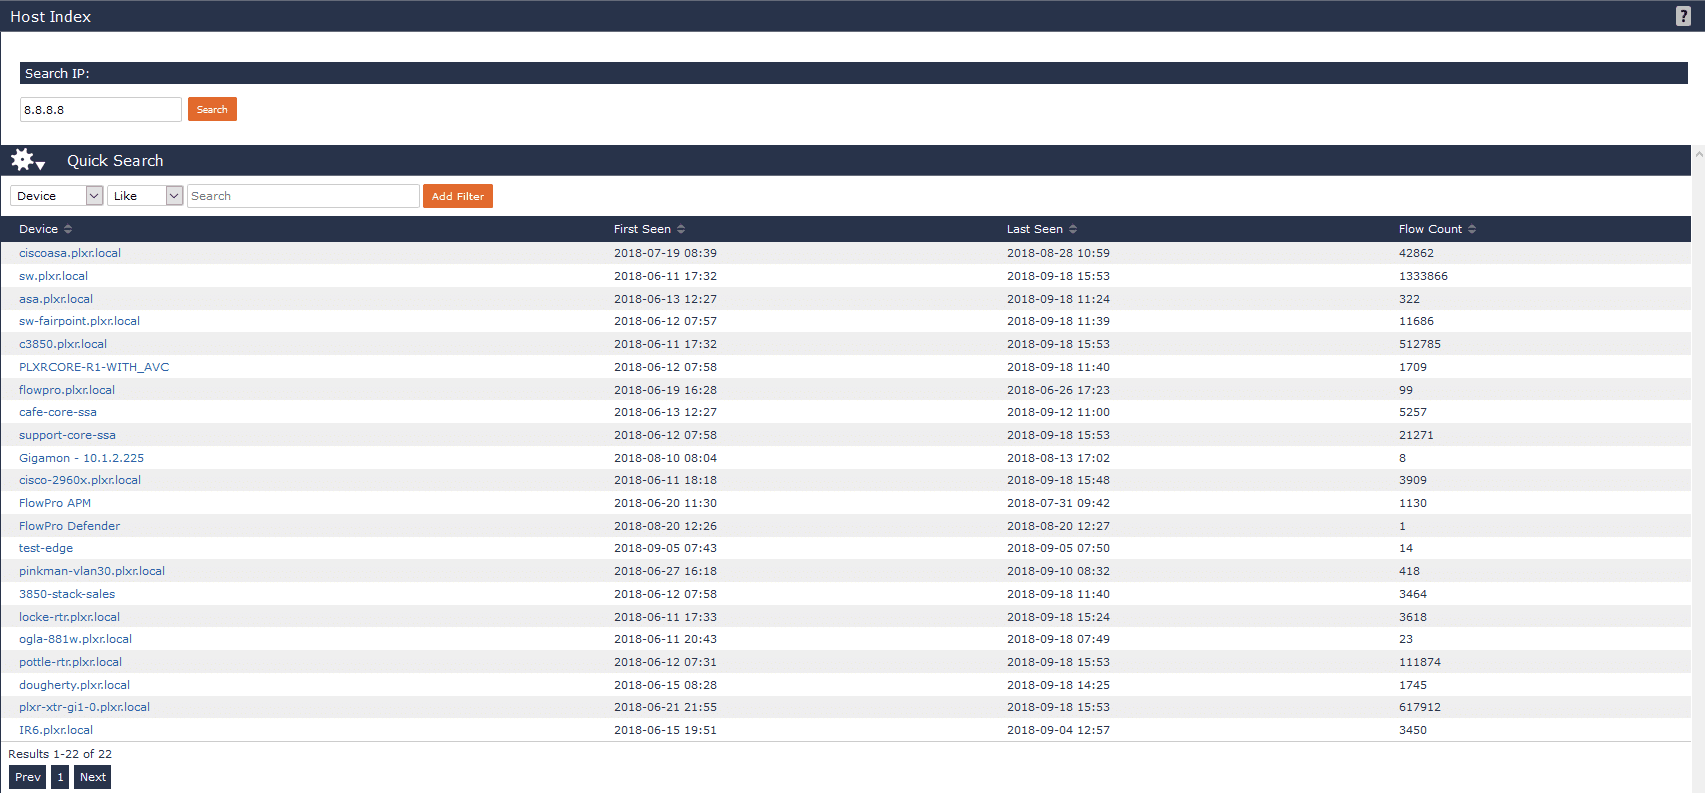
Here we can see that we do indeed have users reaching out to a public DNS server. I can also investigate further to determine who internally has been observed communicating with the suspicious host.
While these are just a few examples of how NetFlow/IPFIX data can help gain insight into suspicious traffic, the possibilities of what can be uncovered with IPFIX exports is limitless. Whether you’re on the NetOps or SecOps side of the house, having visibility into all network communications is crucial to any incident response protocol. By differentiating our arsenal of tools based on department, it becomes apparent that we’re limiting our NoC and SoC’s potential. At the end of the day, data silos are being broken. Network teams and security teams are working closer together than ever. With more of a push towards integration between tools, we’re seeing a more synergistic approach to network monitoring as a whole and not siloes focusing on very niche use cases. To gain valuable insight and analysis of your network traffic, try our fully supported 14-day evaluation of Scrutinizer.