
UPDATE: A new version of documentation is available here.
This week I have had a few customers ask how to integrate Grafana with NetFlow to improve their network operations center. For those of you who don’t know, Grafana is an open source platform that can be used to visualize a wide variety of data types. With Scrutinizer’s API, NetFlow can be one of them!
Typically, a NOC or SOC “command console view” provides multiple screens that give high-level data and alerts that analysts can glance at for a health check of the network. Grafana works great for this. A company can have the ever-sought-after ”single pane of glass” while keeping best-of-breed solutions doing their work under the hood. The integration we nailed together accomplishes this; the customer was able to get high-level reports into their Grafana instance and still use the Scrutinizer UI for forensic investigation and more complex filtering as needed.
NetFlow to Grafana: Setting Up the Integration
To get started, we will need to make sure the Grafana instance has the simpleJSON data source.
Next, we should take a quick look at the simpleJSON documentation, which explains three different routes we will use within our script:
- The ”/“ route is used to return a 200 status code to show simpleJSON that we are up and running.
- The ”/search” route will return an array of different report types that can be graphed in Grafana.
- The ”/query” route will return the JSON object from Scrutinizer’s API.
I have found that either Node.js with Express or Python with Flask do a great job of listening for these routes and formatting the data for simpleJSON.
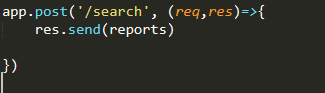
Here is an example from Node. When a POST request from Grafana hits the ”/search” route, our application sends back an array of available reports to use for querying the data.
If we look at the request object passed from Grafana, there are some key fields that we should use to retrieve data from Scrutinizer—namely the “to” and “from” timeframes and the “target,” which in our case is the report we want to be graphed.
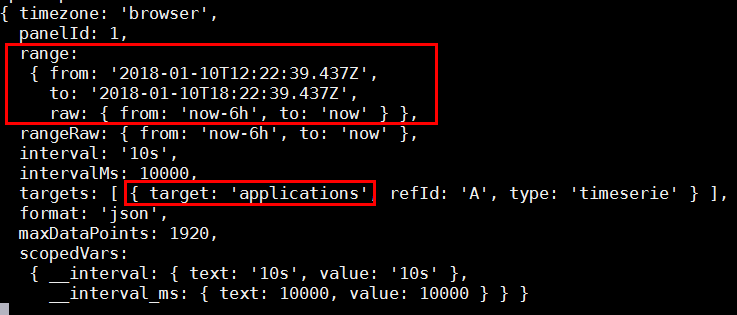
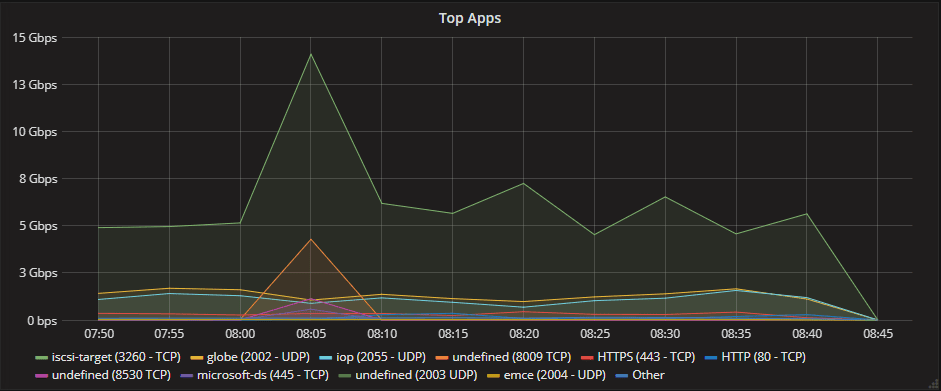
By parsing these elements from the Grafana request, our integration becomes a lot more dynamic. We can click and drag into the graph, add different report elements, and start to harness the power of Grafana.
Integrations like this are the reason I’m happy to work for a company whose solution has a robust API. Within an hour, the customer and I were able to get reports heading into Grafana and we both learned some cool stuff along the way.
If integration with Grafana or other third-party integrations are of interest to you, please contact our support team for help getting started.