An updated way to create url-based reports can be found here.
What can NetFlow report integration using URLs do for you? We already know that NetFlow reporting provides powerful data analysis for your Network administrators and also your Server administrators. However, NetFlow monitoring solutions are not typically the only network management tool in use at an organization. So then, by bringing NetFlow reports into your existing network monitoring solution, you can add a wealth of vital network traffic information that may have been previously unavailable.
A few years back, I wrote about integrating NetFlow reporting with network management applications. The information in that blog is still valid, but now I’d like to expand upon the NetFlow integration possibilities available.
The need for an update to that blog came about recently because one of our customers, using the ScienceLogic EM7 Network Management solution, asked if we could include NetFlow report URLs in his EM7 interface. Well, the answer, of course, is yes. So then the next logical question is – how?
He had two basic requests:
- Click on a device in EM7 and an updated Top Interfaces view of interfaces for that device would display.
- Click on an interface in EM7 and display Top Applications/Talkers/QoS, etc. for that interface.
Display Top Interfaces view
The first request can be resolved with the following Report URL:
http://10.1.1.1/ti.html?search_str=10.7.2.1
Where 10.1.1.1 is the IP Address of your Scrutinizer NetFlow and sFlow Analyzer and 10.7.2.1 is the IP Address of the device selected in EM7.

You can also display NetFlow Top Interfaces for a group of ‘Like’ interfaces, such as VLANs, or ‘inside’ or ‘outside’ interfaces, by using a keyword as a filter instead of the exporter’s IP Address.
Example:
http://10.1.1.1/ti.html?search_str=VLAN
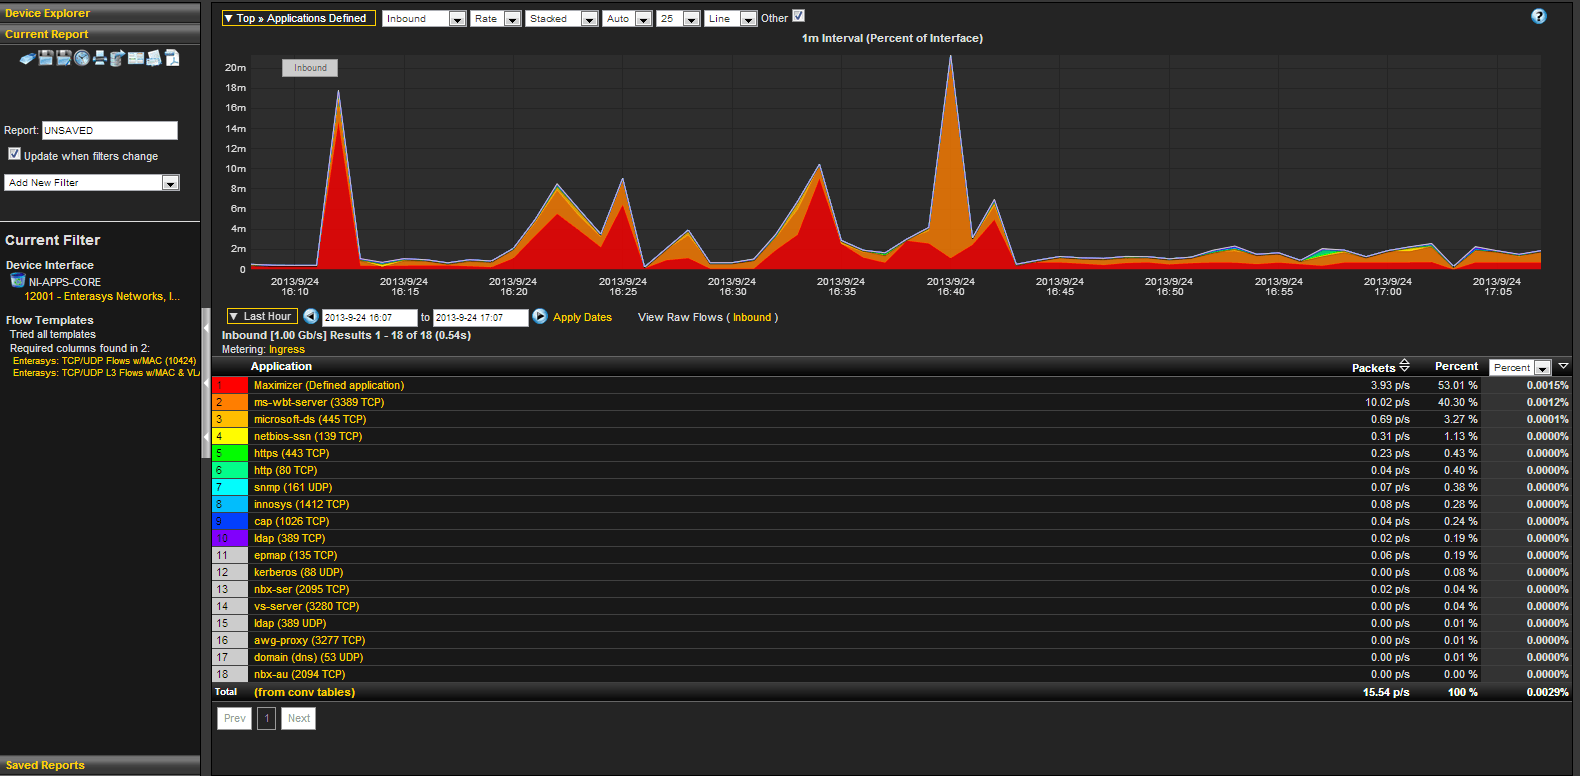
Display Top Applications/Talkers/Qos/etc.
For the second request, I’ll refer back to the NetFlow reporting integration blog mentioned, and linked to, at the beginning of this blog, with this example of the URL:
http://10.1.1.1/index.html?max=1&popID=NEW&newFilterType=sdfDips&newFilterData=out_0A010101_0A010101-12001&newReportType=applications&dateRange=LastHour
This URL example will display Top Applications for device “0A010101” (device ip address in hex format) and interface instance 12001, for the last hour.
Other NetFlow report views
You can also include your existing saved Flow reports with this URL:
http://10.1.1.1/index.html?popID={report_id}&max=1
To get the report ID for your saved Flow report, go to Status->Saved Reports, then click on the Display report filter icon next to your Saved report. The report ID displays in the report filter information.
What does this mean for you?
It means that you can now have the best of both worlds. You can continue using the Network Management Solution that you have been using for years, and are very comfortable with, and also add the indepth NetFlow reporting that we have all come to know and love most recently.
So, my final question is, can we help you with integrating NetFlow reporting in your existing network traffic monitoring solution? If so, please contact us at 207.324.8805 and we’ll show you how you can put this NetFlow integration to work for you too.