
Gluing disconnected systems together with MCP for improved network visibility
Your inventory says a device exists. Your flow monitor says what is sending. Neither one, by itself, can tell you whether every documented device is actually being monitored.
That gap is where blind spots live. A device can remain Active in Nautobot while sending no flow to Plixer Scrutinizer. The reverse can happen too: Scrutinizer can receive flow from live infrastructure that never made it into the inventory. When both systems are available to the same MCP-compatible AI client, one plain-English question can reconcile the two records and show the mismatch.
In this walkthrough, Claude Desktop connects to the Nautobot and Plixer MCP servers. Nautobot supplies the documented inventory and site context. Plixer Scrutinizer supplies live exporter status and flow data. Claude queries both systems and compares the answers.
The short version: Nautobot shows what should be there. Scrutinizer shows what is reporting. MCP lets your AI compare the two.
What You Need
- Nautobot with a current device and IP inventory
- Plixer Scrutinizer with the MCP server available
- An MCP-compatible AI client configured to connect to both servers
Use Case 1: Find Monitoring Blind Spots (Scrutinizer + Nautobot)
Setup: Claude Desktop connected to the Scrutinizer and Nautobot MCP servers. The workflow is a single plain-English prompt.
The scenario
Your team documents every network device in Nautobot IPAM, your source of truth. But documented does not mean monitored. A device can sit in the inventory, marked Active, and still send no flow to Scrutinizer, which means you have a blind spot you don’t know about.
No single tool can tell you this. Nautobot knows what should exist, Scrutinizer knows what is actually reporting, and the answer is the difference between the two.
The prompt
Which of the network devices documented in Nautobot are not sending flow to Scrutinizer? I want to find monitoring blind spots: devices we think we’re watching but actually aren’t.
What Claude does
It pulls the full device inventory from Nautobot, checks each device’s IP against Scrutinizer’s exporter lookup, and diffs the two lists. It runs the checks in parallel and uses Scrutinizer’s authoritative per-IP lookup, so the results are verified rather than guessed.
The result (Claude’s actual answer)
8 of your 10 Nautobot devices are blind spots — documented and Active but not sending flow to Scrutinizer:
| Device | IP | Site |
| bos-core-01 | 10.42.100.142 | Boston |
| bos-app-01 | 10.42.100.143 | Boston |
| bos-web-01 | 10.42.100.155 | Boston |
| den-core-01 | 10.42.150.233 | Denver |
| den-app-01 | 10.42.150.246 | Denver |
| den-web-01 | 10.42.150.15 | Denver |
| app-server-01 | 10.1.1.20 | HQ Lab |
| dns-server-01 | 10.1.1.53 | HQ Lab |
Actually sending flow (verified): core-switch-01 (10.1.1.5) and edge-probe-01 (10.1.1.250). The Boston and Denver sites are entirely dark in this comparison: all six remote-site devices are blind spots. Also a naming mismatch: core-switch-01 in Nautobot is registered as core-router-01 in Scrutinizer at the same IP.
Why it lands
In one plain-English question, Claude reconciled two systems that have no knowledge of each other and surfaced concrete monitoring gaps, including six documented devices across two sites that were not reporting, plus an identity inconsistency that would slow down a real incident. That is the whole point of connecting your source of truth to your live network data: you find the things that fall between the tools.
Use Case 2: Find Live Devices Missing from Your Inventory (Scrutinizer + Nautobot)
Setup: Claude Desktop connected to the Scrutinizer and Nautobot MCP servers. The workflow is a single plain-English prompt.
The scenario
This is the mirror image of the blind-spot audit in Use Case 1. Instead of asking “what did we document but fail to monitor,” it asks, “what are we monitoring that we never documented.”
Scrutinizer sees every device actively sending it flow. Nautobot holds what your team formally recorded. The gap in this direction is shadow inventory: live network gear your source of truth has no record of.
The prompt
Which devices actively sending flow to Scrutinizer are not documented in Nautobot? I want to find gaps in our source of truth: things that are live on the network but missing from our inventory.
What Claude does
It pulls the list of devices actively exporting flow from Scrutinizer, pulls the documented inventory from Nautobot, and diffs them. Along the way it noticed that Scrutinizer’s quick search was capping its results and shifting between calls, so it distrusted that list and fell back to the authoritative topology count to get the true number of exporters before reconciling. It also excluded the collector’s own loopback rather than reporting it as a device, and double-checked Nautobot’s full IP inventory for secondary interface addresses — so the unmatched exporters are true gaps, not primary-IP mismatches.
The result (Claude’s actual answer)
Scrutinizer is receiving flow from 13 real devices (plus its own loopback, ignored). Only 2 of them exist in Nautobot, so 11 live flow exporters are missing from the source of truth:
| Exporter IP | Scrutinizer name |
| 10.1.1.17 | switch-floor-2 |
| 10.1.1.19 | switch-floor-3 |
| 10.1.1.41 | (no SNMP sysName) |
| 10.1.1.42 | (no SNMP sysName) |
| 10.1.1.70 | (no SNMP sysName) |
| 10.1.1.221 | (no SNMP sysName) |
| 10.1.1.222 | (no SNMP sysName) |
| 10.1.1.249 | palo2.plxr.local |
| 10.1.2.21 | (no SNMP sysName) |
| 10.40.2.3 | cisco-capwap-controller.plxr.local |
| 10.42.11.250 | (no SNMP sysName) |
The only documented exporters are 10.1.1.5 (Scrutinizer calls it core-router-01; Nautobot calls it core-switch-01 — a naming mismatch) and 10.1.1.250 (edge-probe-01). Most of the gaps sit in 10.1.1.0/24, a subnet Nautobot itself labels “Finance-DMZ, monitored by Scrutinizer,” and several are significant infrastructure (the Palo Alto firewall, the CAPWAP wireless controller), not just endpoints.
Why it lands
Paired with the blind-spot audit, this closes the loop. One direction finds coverage gaps, the other finds inventory gaps. Together they answer “how well does what we wrote down match what is actually on the network,” and here the answer is that the source of truth is missing real, active infrastructure, including a firewall and a wireless controller. Those are exactly the devices you do not want undocumented.
Use Case 3: Ask About Your Network by Site Name (Scrutinizer + Nautobot)
Setup: Claude Desktop connected to the Scrutinizer and Nautobot MCP servers. The workflow is a single plain-English prompt.
The scenario
Your flow tool organizes the world by IP addresses and exporters. Your team thinks in site names: Boston, Denver, the HQ lab. Scrutinizer has never heard of “Denver,” but Nautobot has. So when you ask a plain-English question scoped to a site, Claude leans on Nautobot to translate the site into its actual devices, then checks Scrutinizer.
The prompt
For our Denver site, tell me what’s there and whether Scrutinizer is actually monitoring it.
What Claude does
Nothing in the prompt tells it which system to use. On its own, it recognizes Scrutinizer has no concept of “Denver,” goes to Nautobot to resolve the site into its documented devices, checks each device’s IP against Scrutinizer’s exporter status, and answers in site terms rather than raw IP addresses.
The result (Claude’s actual answer)
The Denver site is in Nautobot as an active Site with three active devices, all on 10.42.150.0/24:
| Device | IP | Description |
| den-core-01 | 10.42.150.233 | Denver core switch |
| den-app-01 | 10.42.150.246 | Denver app server |
| den-web-01 | 10.42.150.15 | Denver web server |
No, Scrutinizer is not monitoring those three documented devices. All three IPs were checked against Scrutinizer’s authoritative exporter list and none is a registered flow exporter, including den-core-01, the core switch that would normally be exporting NetFlow/IPFIX. Denver exists and is active in the source of truth, but none of those three documented devices is sending flow, so there is zero flow visibility into the site right now.
Why it lands
You asked about “Denver,” a concept your flow tool does not have, and got a straight answer about what is there and whether it is covered. That is the accessible face of the federation: you ask in your own vocabulary, and Claude bridges the system that knows your naming to the system that sees your traffic.
Use Case 4: Automated ITSM Ticket Enrichment (n8n + GLPI + Scrutinizer)
The first three use cases put a human in the loop: an engineer in Claude Desktop asking questions. This one removes the human from the first pass.
Recent advancements in AI development are enabling more autonomous network investigation workflows. There’s a plethora of AI workflow harnesses in the market, and n8n is one of the best (and open-source for community-license features, which we highlight below). Here’s how a powerful AI workflow tool like n8n coupled with Scrutinizer can provide real value for your IT / NOC team.
Setup: an n8n AI workflow connected to the Scrutinizer MCP server, listening for new ITSM tickets.
The scenario
Users on your network periodically experience network-related issues, and tickets find their way into your ITSM (ServiceNow, GLPI, etc.). Imagine an AI agent with access to your actual network data that could triage and enrich those tickets with real-time detail automatically. Scrutinizer’s MCP server allows exactly this sort of agentic access.
The setup
An n8n agentic workflow listens for any new issue created in the ITSM, and the n8n AI Agent node has access to the Scrutinizer MCP server. When an IT ticket is created, the agent automatically checks whether it could be a network issue, and if so, begins querying Scrutinizer’s MCP server for real-time network data to debug it. At the end of its processing, the agent appends its findings to the ticket as a comment. If the agent doesn’t think the issue is network-related, nothing happens and the ticket is left for human review.
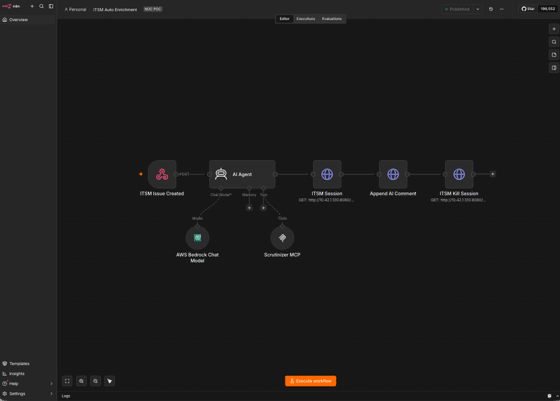
n8n workflow: ITSM trigger feeding an AI Agent node connected to the Scrutinizer MCP server
Example 1: “Zoom is laggy” (Finance user)
For a proof of concept, we created a ticket in our ITSM (GLPI) pretending to be a user in Finance complaining about Zoom being laggy. The AI workflow was triggered, and the agent returned findings that Scrutinizer showed a jitter-related performance issue, and that our 10.10.10.250 host was being flooded with IPFIX data. In our case that was expected, since we are a flow monitoring company, but in a normal environment a possible sign of a misconfigured switch or router. In our test, all this context was added to the ticket without manual intervention, under 3 minutes after the ticket was created.
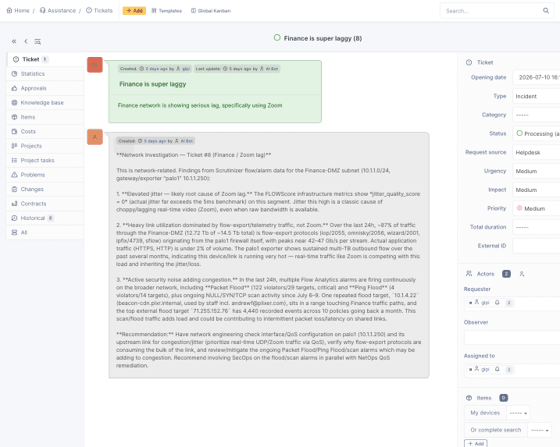
GLPI ticket automatically enriched with FLOWScore jitter findings and IPFIX flood detail
Example 2: “High outbound traffic from 10.1.1.5”
The agent confirmed the host is a registered flow exporter, pulled its historical volume, surfaced its alarm history, and broke down the last 24 hours of conversations. It read the traffic as heavy but consistent with legitimate NetFlow/IPFIX export rather than exfiltration, with concrete next steps and a clickable link straight into the report.
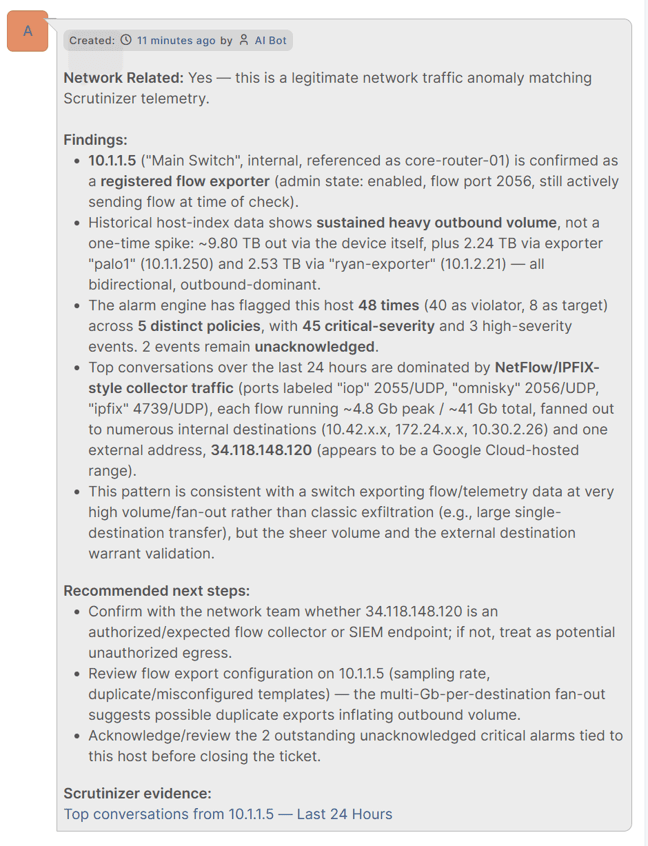
GLPI ticket enriched with the agent’s analysis of the high-outbound-traffic host
Example 3: “Possible data exfiltration to 34.118.148.120”
Handed a scary-sounding security ticket, the agent resolved the IP to a Google Cloud address (Montreal region), then found the traffic was overwhelmingly inbound across 68 internal hosts, the opposite of an exfiltration pattern. It concluded this is a legitimate cloud service rather than a breach: a nuanced, non-alarmist verdict that avoids the false-positive escalation an analyst might have made.
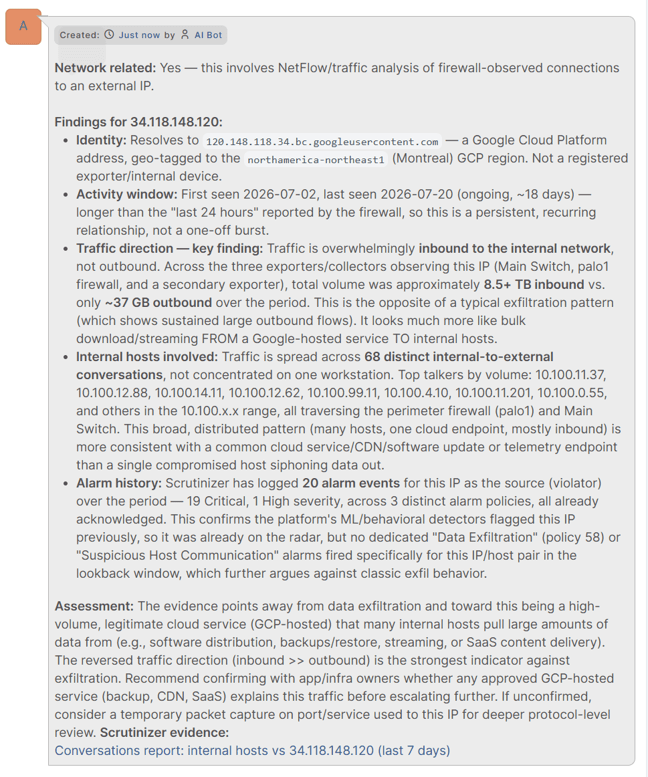
GLPI ticket where the agent ruled out data exfiltration with directionality evidence
Conclusion: Ask the Question Between the Tools
Most monitoring gaps do not live entirely inside one product. They sit between the inventory you trust and the data your monitoring system receives. Connecting Nautobot and Plixer Scrutinizer through MCP gives your AI access to both sides of that gap.
Start with the simplest reconciliation: ask which documented devices are not sending flow. Then reverse it and ask which live exporters are missing from the inventory. The result is a practical coverage check built from the network data and source-of-truth records you already maintain.
No new data plane, no new permission model. The AI you already run can now ask questions of the network you already built.
Next Steps
- Watch the Nautobot and Plixer MCP demo
- Review the Plixer MCP documentation before connecting a client.
- Run the two-way inventory comparison in a test environment, then investigate each mismatch.
Frequently Asked Questions
No. The Plixer MCP server is an integration that exposes Scrutinizer tools and data to a compatible external AI client. Plixer AI includes the built-in AI Assistant and AI Insights experiences.
No. Nautobot remains the source of documented inventory and site context. Scrutinizer remains the source for collected flow data and exporter status. The AI coordinates requests across both systems.
Use an MCP-compatible AI client supported by your deployment. Check the current client and Plixer documentation before setup.
Start in a test environment, confirm permissions and expected results, then expand the workflow under your organization’s change and access controls.
About the Author