Our support team recently received a request for LogPoint NetFlow integration. Just as we confirmed with the other SIEM integrations, NetFlow, IPFIX, and syslog data insight is transparent when navigating between systems.
What’s LogPoint?
LogPoint is a Denmark-based company with sales and support offices throughout Europe and partnerships with a global reach. The LogPoint solution is an advanced Security Information and Event Management (SIEM) platform in its 5th version. It is designed to collect, analyze and monitor data from the entire network infrastructure for Compliance Management, Information Security, Application Security Monitoring and Operational Insight. The SIEM often gets complimented on its powerful Big Data analytics, beautiful design, built-in scaling architecture, extensive integrations, and favorable licensing. Its built-in log analysis engine automatically detects and notifies you of all critical incidents on your systems. The monitored events can be quite diverse, including user authentication issues, an ongoing attack, a compromised system, a system breakdown, etc. Among its customers are Danish Crown, Copenhagen Airports, Terma, DISA and many others.
LogPoint NetFlow Support
This time we’ll focus on the simplest integration. Our customer wanted to create a way in Scrutinizer that allows him to click on an IP address and select the LogPoint menu option. Then by selecting ‘Logpoint,’ it would pass the time frame and IP address variables in a URL string. In order to launch the LogPoint interface from Scrutinizer, our developers recommend making changes to applications.cfg. This file can be found in the /files/ directory of the Scrutinizer installation.
The following entries must be added for Source and Destination:
LogpointSrc, https://url_to_logpoint/#Logs/searchLogs?query=source_address%3D%i&time_range=%zs+To+%ze&limit=25&, LogpointSrc
LogpointDst, https://url_to_logpoint/#Logs/searchLogs?query=destination_address%3D%i&time_range=%zs+To+%ze&limit=25&, LogpointDst
Notice that the URL is preceded by [LogPoint,] and appended with [, LogPoint].These values declare the name of the option in the menu as it appears in the image below when you click on an IP address in Scrutinizer.
Let’s save the changes to the application.cfg file and put our integration with LogPoint to a test.
See it for yourself
As a result of the Logpoint NetFlow Integration work we did, we can now click on an IP address found in our NetFlow analyzer to go to the LogPoint system. The SIEM will then display the events for the host for the selected time frame. When greater context is needed, Scrutinizer can provide details on username, operating system, and more by integrating with 3rd-party authentication systems such as Microsoft Active Directory, Cisco ISE, etc.
I’m going to run a Pair: Conversations WKP (Well-Known Ports) report on one of our core router’s interfaces. As I click on any source or destination host IP address in the report table, I can proceed to the “Other Options” menu and choose “LogPoint Source”:
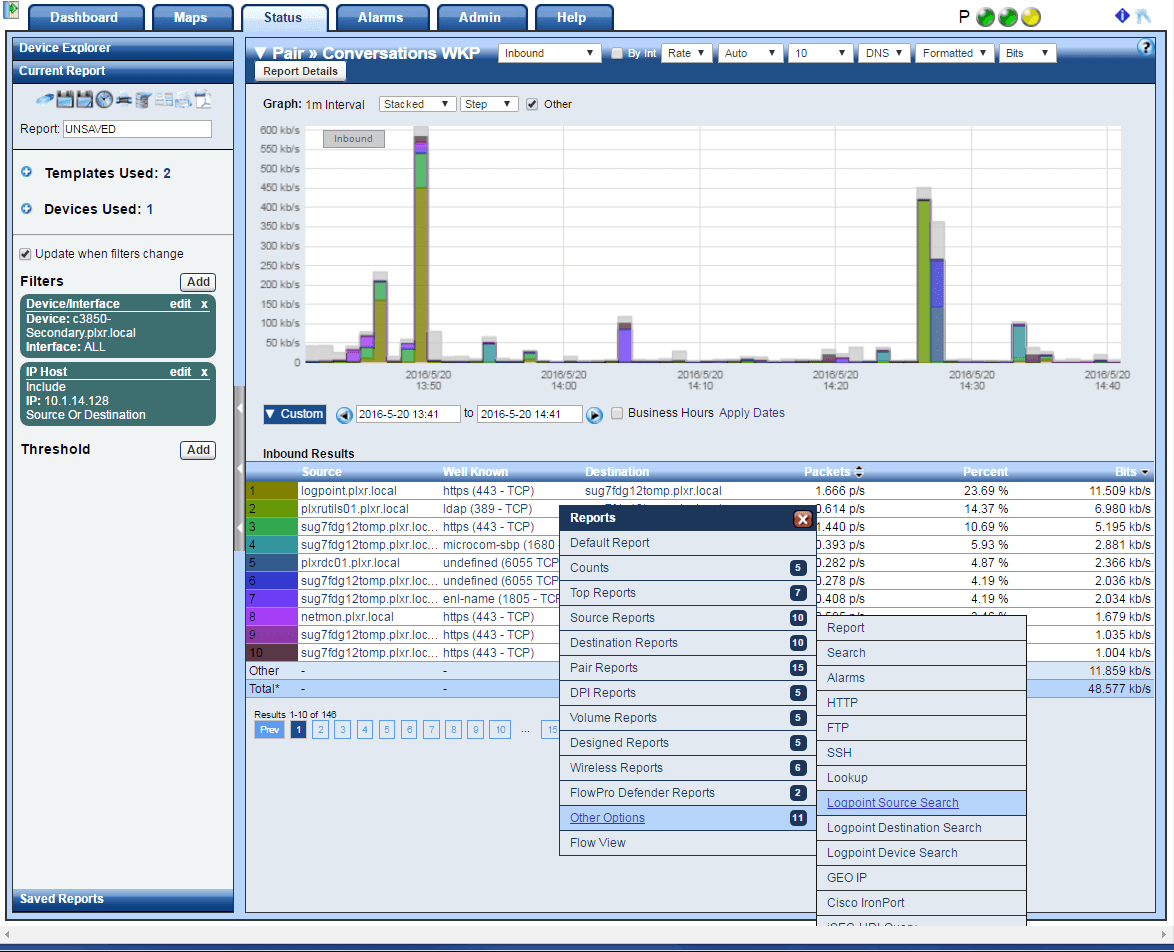
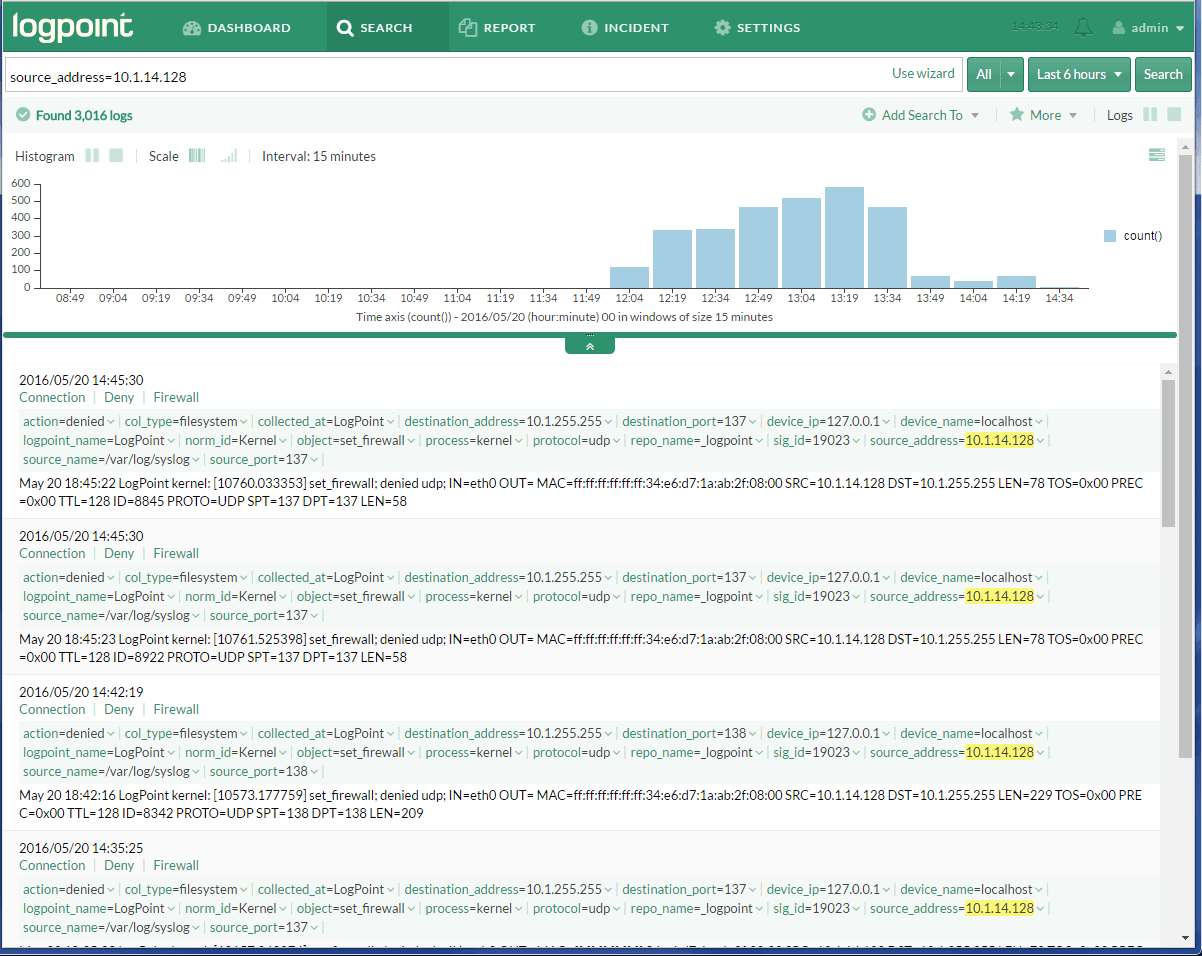
By selecting the ‘LogPoint Source Search’ option in the menu above, we can launch a new web browser that brings up the LogPoint interface. Scrutinizer passes the IP address that was clicked on (10.1.14.128) as well as the time frame in the URL. See the results of this LogPoint NetFlow support below:
BTW: We also setup Splunk Netflow Support and Elasticsearch Netflow Support with Kibana.
What’s Next?
Need help with setting up integration with LogPoint? Call our support team to get immediate assistance.