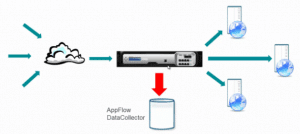
How do you configure your NetScaler to gain insight into your network using AppFlow and an advanced NetFlow analyzer to collect user-session level information? This information is invaluable for application performance monitoring, analytics, and business intelligence applications.
The configuration utility provides tools that help users define the policies and actions that determine exactly how the NetScaler appliance export records for a particular flow to a set of collectors.
You configure Citrix AppFlow in the same manner as most other policy‐based features.
First, you enable the AppFlow feature.
Then you specify the collectors to which the flow records are sent.
After that, you define actions, which are sets of configured collectors.
Then you configure one or more policies and associate an action to each policy. The policy tells the NetScaler appliance to select requests the flow records of which are sent to the associated action.
Finally, you bind each policy either globally or to a specific vservers to put it into effect.
The NetScaler command line provides a corresponding set of CLI-based commands for experienced users who prefer a command line.
Now it’s time to put these AppFlow exports to use.
An advanced collecting and reporting tool will let you quickly generate TopN reports, including top applications being requested, top application pages/resources, top sources of application demand, top browsers (including version) accessing each application to better understand how users are leveraging an enterprise’s online resources.
Let’s take a look at a couple examples of the kind of reporting filters that you can use to gain visibility.
We can apply an Application ID filter to a connection report to gain insight to the VIP and Server pairing and the total traffic and latency that you are seeing on a flow by flow basis.
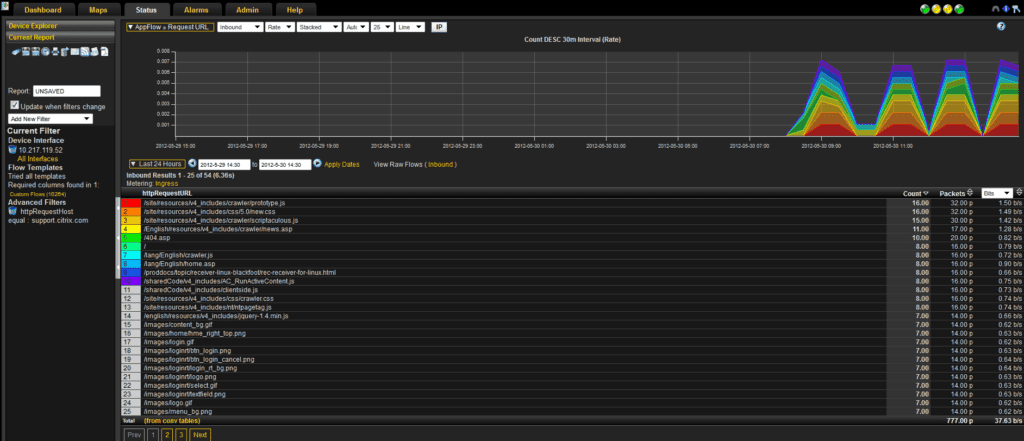
See all of the URLs that a particular Host is calling, and see the traffic counts based on the number of flows and packets, and the amount of traffic generated.
I’m sure that every Administrator has encountered this type of call at least once in their career.
A user calls and says “I’ve been having a little bit of trouble with the Internet, its been kind of slow.”
With Citrix AppFlow you can gain insight into exactly what is going on with your environment helping you to solve the customer experience riddle.
What exactly is traversing your Network?


