Here at Plixer, we often handle confusion from new customers as to what 95th percentile billing is and how it works. Since it is such a prevalent method, I could not miss an opportunity to explain the math behind it and provide insight into 95th percentile usage in bandwidth billing and network capacity planning. I will also explain how you can use Scrutinizer Traffic Volume reports to figure out your 95th percentile.
What exactly is this 95th Percentile?
The 95th percentile is a widely used mathematical calculation to evaluate the regular and sustained use of a network connection. The 95th percentile says that 95% of the time, the usage is at or below a certain amount. Thus 5% of the samples may be bursting above this rate.
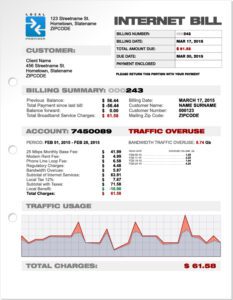
In an attempt to keep prices competitive and attract new customers, some service providers try to bill customers based on usage. Here is how it works: a customer’s bandwidth is measured from the switch or router and recorded in a log file. At the end of the month, the samples are sorted from highest to lowest and the top 5% (which equal about 36 hours of a 30-day billing cycle) of data is thrown away. The next highest measurement becomes the billable usage for the month.
Ignoring the top 5% of the samples seems reasonable in most cases. For instance, since most networks are overprovisioned, there is often some room for some bursting without advanced capacity planning. 95th percentile billing also allows a customer to have a short (less than 36 hours, given a monthly billing period) burst in traffic without overage charges.
How is the 95th percentile calculated?
First, collect the data samples for a period of time (typically, a day, a week, or a month). Sort the samples from smallest to largest. Then the number of data samples is multiplied by .95 and rounded up to the next whole number. The value in that position is the 95th percentile.
For example:
Data points =[1,2,3,4,5,6,7,8,9,10,11,12,13,14,15,16,17,18,19,20,21,22,23,24,25]
25 data points * .95 = 23.75
Round 23.75 up to the next whole number (24)
The value in position 24 is the 95th percentile, which is 24.
What are the advantages of using 95th percentile billing?
- 95th percentile is industry standard for Tier 1 and Tier 2 settlement-based peering, transit, and customer connections
- 95th percentile is an averaging method, which is less volatile than actual usage
- The carrier has guaranteed minimum bandwidth commits that allow them to scale upstream capabilities more consistently
- Bursty customers are billed more than sustained customers for the same data, which takes into account that the impact of bursty traffic is greater and more difficult to plan for
- Customers can pay for what they use (to some extent) rather than having a bandwidth cap applied
- Carriers do not need to try to shape or police Ethernet traffic down to the customer’s commit rate, which lowers the carrier’s cost basis for infrastructure and management
Note: Critics of the 95th percentile billing method usually advocate the use of a flat rate system or using the average throughput. Both those methods favor heavy users. Other critics suggest billing per byte of data transferred.
Capacity Planning and Network Usage Billing with NetFlow
As my colleague Jake points out in his blog on capacity planning fundamentals, one of NetFlow’s primary intended uses was for network traffic billing and capacity planning. “One of the largest benefits of collecting NetFlow/IPFIX is that you can trend this data for multiple years while retaining conversation granularity, allowing you to pinpoint exactly what application is causing the sudden increase in bandwidth utilization,” says Jake.
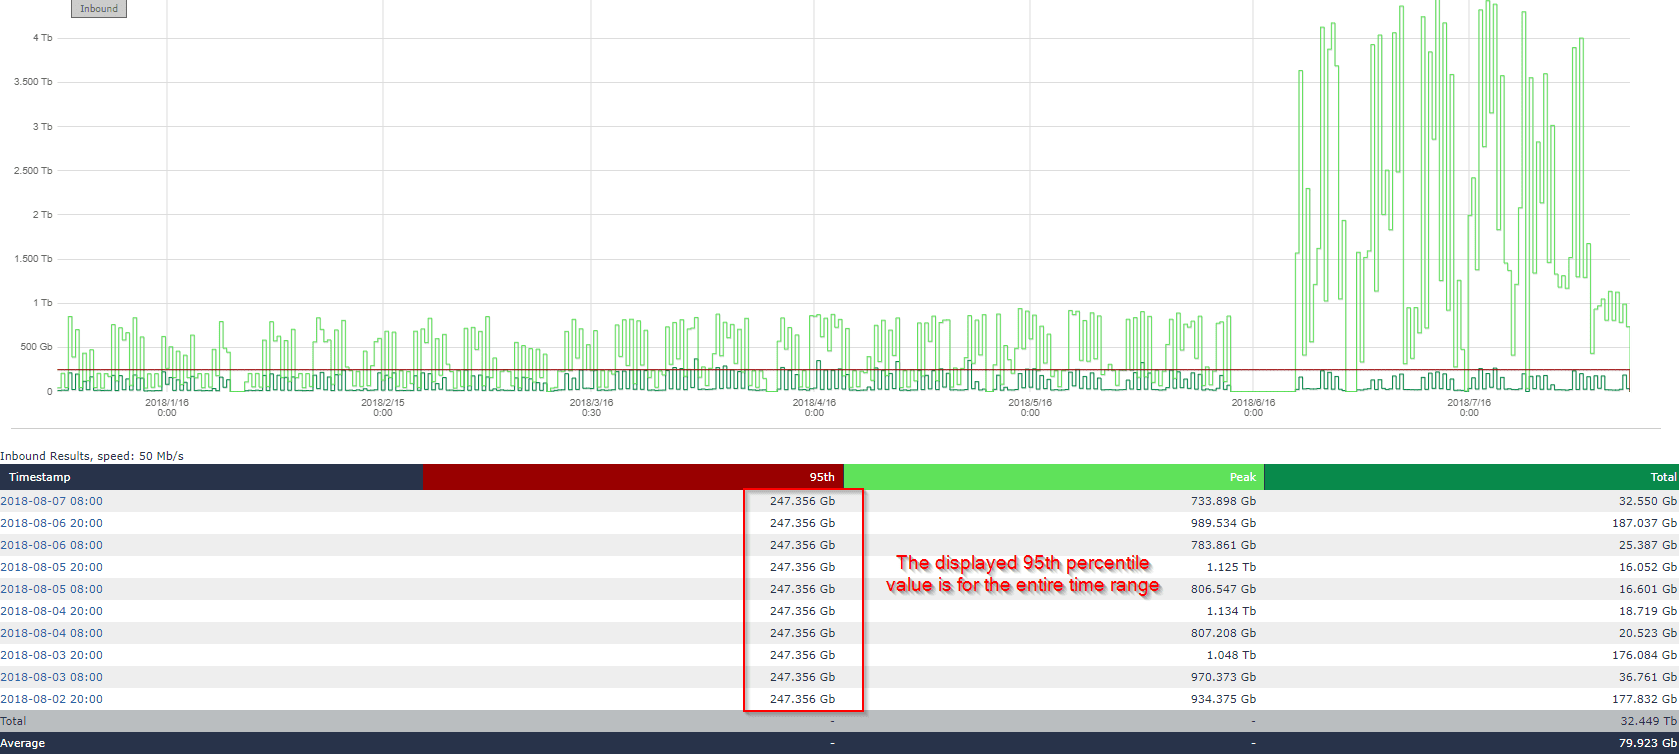
Capacity planning reports come in handy when you need to make sure your trends are within scope of your infrastructure:

Note: If a report has less than 21 data points, the largest number is always the 95th percentile. Increase the granularity in the report for increased accuracy.
Now that we know the benefit of using 95-percentile reporting for capacity planning, what else can we do? If we integrate our NetFlow collector with other tools, we can add more context to the data we collect.
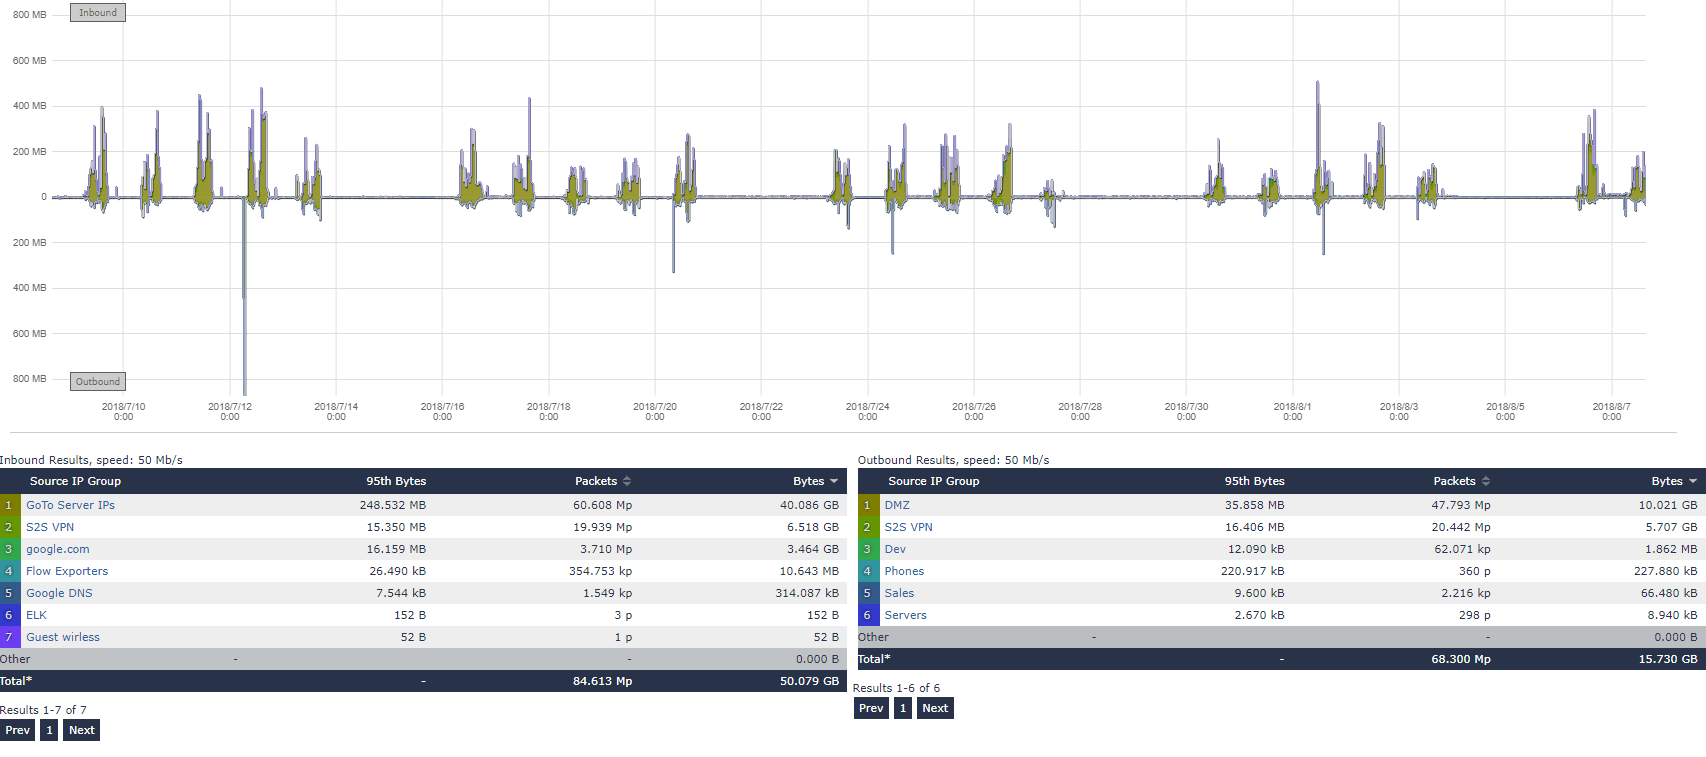
By adding logical IP groups to your reports, you can pinpoint issues down to specific groups on the network. In the 95th percentile billing report below, the metric is calculated separately for each IP group representing a customer account:

Network capacity planning and billing can be rather tricky. Contact our support team if you need help with NetFlow configurations and creating granular reports to monitor your links utilization.


