I was reading up on the latest release (January 2014) of the Gartner Application Performance Monitoring definition and found myself constantly thinking about how NetFlow or IPFIX can be used to deliver on the objectives that Gartner outlined. I think it is interesting to learn about how these new technologies are expanding beyond traditional byte metrics.
This is a follow up post to Mike’s blog on Gartner Magic Quadrant for Application Performance Monitoring. In this post, the Gartner Group defines Application performance monitoring (APM) as a process with five objectives:
- Tracking, in real time, the execution of the software algorithms that constitute an application.
- Measuring and reporting on the finite hardware and software resources that are allocated to be consumed as the algorithms execute.
- Determining whether the application executes successfully according to the application owner.
- Recording the latencies associated with the execution step sequences.
- Determining why an application fails to execute successfully, or why resource consumption and latency levels depart from expectations.
Let’s tackle each of the above with specific examples on how IPFIX, the IETF standard for all flow technologies, could be leveraged to meet these Gartner Application Performance Monitoring requirements. IPFIX has taken the best features from NetFlow and sFlow technologies and dramatically expands on what is possible.
1. Tracking, in real time, the execution of the software algorithms that constitute an application.
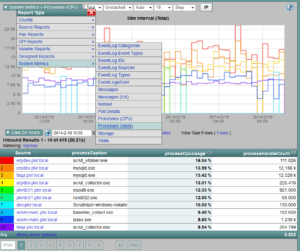
Without the use of agents, metrics on CPU, memory consumption, etc. can all be gathered and exported as IPFIX to a flow collector for monitoring and reporting. Although the image below trends the data in 30 minute intervals, real-time metrics down to the sub-second interval are also possible.

You can see in the above that IPFIX isn’t limited to exporting traditional NetFlow. It can also be incorporated in ways which allow it to provide details on processes, logs and even the flows related to the processes!
2. Measuring and reporting on the finite hardware and software resources that are allocated to be consumed as the algorithms execute.
IPFIX is only limited to measuring and reporting what it can get access to. In other words, like any APM it can only report on the hardware and software resources that lend themselves to monitoring. The only limitation is the application itself. In all the cases that we have run into, the processes, services or algorithms being executed can all be monitored albeit on a Windows or Linux operating system. Details are covered below.
3. Determining whether the application executes successfully according to the application owner.
This is an interesting requirement because even if the process launches and consumes resources, this doesn’t always mean that the application is successfully servicing the end user(s). To do this, we need to be able to follow the sequence of events from the connection request, to the process launched, to the server response as well as the follow on traffic through to termination.
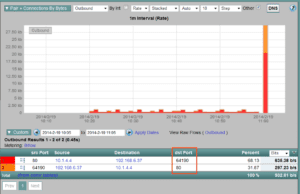
Below a report was run on the VPN traffic through the Cisco ASA. You can see the connection from the end system (192.168.6.37) to the server (10.1.4.4). The end system is connecting to destination port 80 from source port 64190.

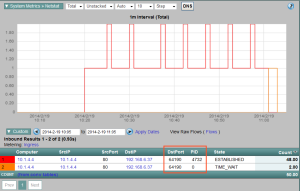
Below a report was run on the server. You can see the same IP addresses show above as well as the same ports with the addition of the process ID (PID) which is 4732.

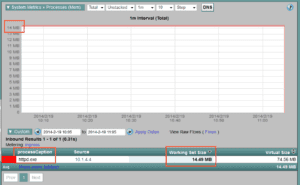
Below a filter was added for PID 4732 and the report was changed to show the processCaption (httpd.exe) as well as the Working Set Size (14.49 MB) which equates to the amount of constant memory being used by the process. We could just as easily trend the CPU utilization for the process.

Clearly, we can monitor all facets of the application including log messages so long as the application does its job and allows itself to be monitored.
4. Recording the latencies associated with the execution step sequences.
This is another area of application performance monitoring where IPFIX continues to shine. In fact, Cisco AVC did much of the work for us. Take a look at all of the amazing latency metrics exported by
Cisco router using IPFIX:
- Connection Setup Time
- Server Response Time
- Network Round Trip Time
- Transaction Time
- Session Time
The Cisco AVC metrics can also include details on TCP window size, packets retransmitted, URLs and much more. The details are equally sophisticated for voice and video traffic which includes metrics on jitter, packet loss, codec, SSRC, etc. Reports on all of these metrics are available in our flow monitoring and reporting solution.
5. Determining why an application fails to execute successfully, or why resource consumption and latency levels depart from expectations.
In my career, I have had the opportunity to become proficient in a few different application performance monitoring tools. All of which claimed to tell me where the problem is which I never believed and nor should you. What all of the solutions I used did do is provide me with the information needed to empower my brain. In the end, a good technician will leverage the tools provided to determine the root cause of an application issue. Today’s APM solutions are definitely not going to be 100% reliable at telling us the reason for an application problem.
Summary
Application Performance Monitoring is easier when applications are written and behave in a way that allows them to be easily monitored. The solutions available on the market for APM all generally require human involvement to ascertain what and where the issue lies. IPFIX is becoming one of the ideal solutions for next generation application performance monitoring.


