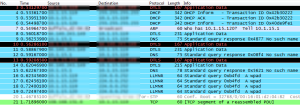
Sometimes when you’re trying to really dig into an issue, you want to expose all of the individual raw flows in their native format. This is why years ago, we introduced FlowView. Think of it as being similar to the packet list view in Wireshark which lists absolutely every packet related to the filter that was typed into the interface. In the flow industry, we have something similar, it’s called FlowView.
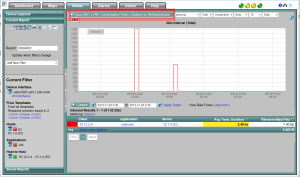
To understand why you need something like Flowview for analyzing NetFlow, IPFIX or even sFlow, it’s best to start with a problem. Below you see a typical example from our NetFlow reporting solution. Notice on the left, that there is a filter:
- Exclude all applications related to ‘cifs’
- Include all traffic between 10.12.2.4 and 10.1.4.252
- Exclude all traffic when 10.1.4.252 is the source
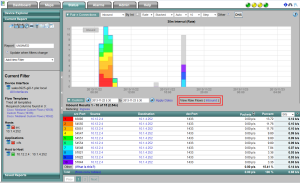
Above, I was narrowing in on a specific issue here in the office. Notice that the average transaction duration time between these hosts for all applications outside of cifs is 2.4 ks or 2400 seconds which equates to about 40 seconds. I then changed the report type to try and figure out how many flows were involved with this number (2.4 ks). To do this, in the upper left corner outlined in red twice is the report type selector. I’ll selected ‘Connections’.
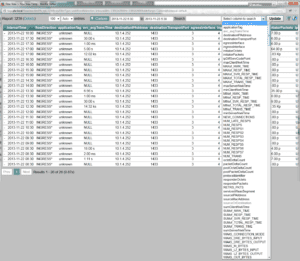
Above you can see that the filter on the left didn’t change and that we are looking at 10 of 15 results. A typical user of our NetFlow Reporting solution knows that this data is likely still aggregated by the GUI. To avoid aggregation, above outline twice in red it says “View Raw Flows (Inbound)”. If you click on this, you will see the raw flows or FlowView shown below:
Above, notice at the bottom left: 26 results. Clearly some aggregation was occurring in the ‘Connections’ report. Aggregation is necessary in most reports however, when performing forensic traffic analysis, it is sometimes nice to get down to the raw unadulterated flows and Flowview offers this. Notice also the massive drop down box displaying all of the elements possible to report on across all of the flow templates used to create the report.
NOTE: since I launched Flowview from a 30 minute interval report, it is possible that some aggregation occurred. To avoid this, I could force the Connections report to 1 minute intervals and then launch Flowview to see the raw flows untouched (I.e. before the collector did any aggregation).
FlowView is our proprietary solution for delivering the absolute most forensic insight into what the router sent related to the traffic you need to investigate. Flow View is just the beginning, learn more about what it takes to be a leader in NetFlow by downloading our white paper “Flow-based Approaches to Network Management”.


