
When it comes to NPMD, there are an incredibly large number of use cases the Plixer Platform can solve. During my time as a Sales Engineer, the most common use case I encounter is bandwidth monitoring or a more generic network troubleshooting. However, there are plenty of other use cases that can help most organizations today. Take Capacity planning as an example.
When most think of capacity planning, they think of edge bandwidth or more specifically WAN circuit usage. While we do have the ability to monitor, report, and trend this usage, we can also trend other metrics. Such as Address space utilization (think VPN or DHCP pools). When it comes to applications and services, do you know how they are being utilized today or how those usages are trending?
The great thing about Plixer’s approach to capacity planning is that it relies on the historical data you are already collecting and is formatted similarly to reports which we should all be familiar with. This also means that we can take any report with historical data and use it to forecast future trends.
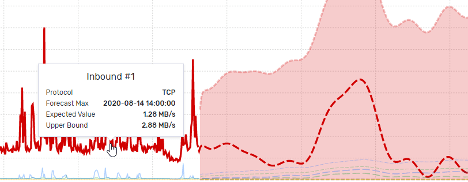
Starting with a popular forecast, bandwidth capacity planning, you’ll notice the Plixer platform is able to identify the high usage times in the past, and through Machine Learning is able to predict when in the future we will have additional high usage times. The red dotted line represents the most likely future value.
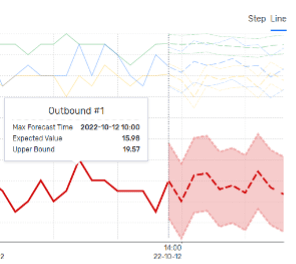
As I mentioned before, we can apply capacity planning to other reports. In this example, I’ve taken a VPN Pool report which looks at the total number of VPN users on a network at any given time and used it to forecast future usage.
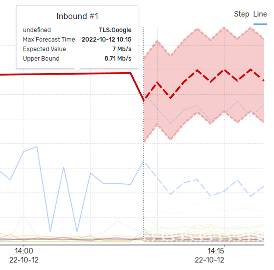
Here is another forecast, but instead of counting users, we are looking at service consumption. In all three of these examples, we can leverage these predictions to make better and more informed decisions around network growth. Will we need to increase our WAN circuits in 6 months? Do we need to grow our VPN or DHCP pool? What about services, will we need to add another application server behind the load balancer to handle an increase in demand? These are all questions you can answer by leveraging the Plixer platform.
Over the last 3 years we have really added a lot to the Plixer Platform. One of the most exciting additions for me is our ability to provide visibility at the endpoint level. Today, we can collect, catalogue and report on device attributes. This means we can also not only provide you with a real-time asset inventory, but we can link network traffic to the end device. There are so many use cases we address here.
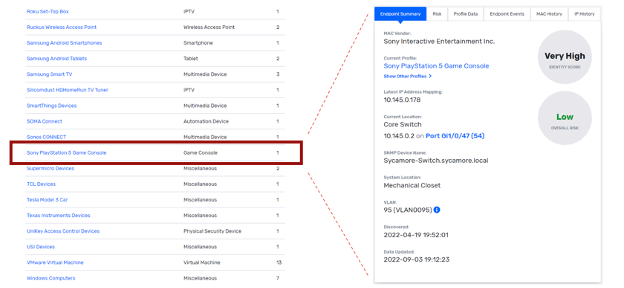
Are there devices on your network that shouldn’t be there? Maybe a game console? No problem, we will tell you where on the network it is connected, and when it was first detected as well as allow you to run traffic reports to see what it’s doing. We track its IP and location over time, so for all your security gurus out there, this is a great way to investigate traffic/devices after an incident.
We can also use this to get specific device counts. For example, are you paying licensing fees to cisco for 50 switches? What if you are only actually using 25 of those? Suddenly you can save a lot of money on licensing costs every year.
The last use case I want to dive into is taking the popular “troubleshooting” use case and going a bit deeper. Anyone on a network team knows how quickly the network gets blamed for performance issues. Today how do you go about investigating these claims? Do you use Scrutinizer for understanding bandwidth? What about latency? Jitter? ToS? These are all metrics the Plixer platform is able to measure and report on.
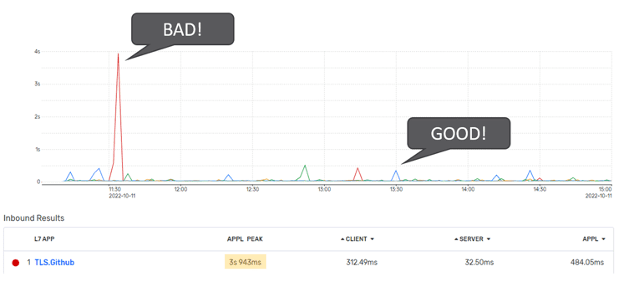
We can not only measure latency, but also break it down into client traffic, server traffic, and application. Adding all three together we get the total round-trip time. But by breaking them down we can identify that it’s the application server that is having the issue, not the network.
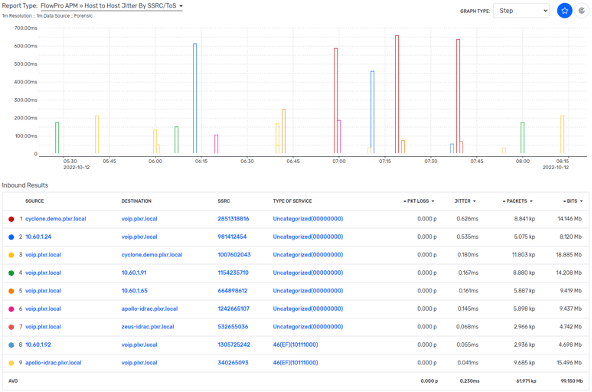
For other metrics such as SSRC, ToS, Jitter, and Packet Loss, the Plixer Platform can measure all these metrics natively. This makes troubleshooting VoIP-based communication traffic much easier. I’ve had customers use Plixer to verify that Class of Service is set up and operating correctly and often misconfigurations like this can lead to poor network performance. I hope that got the wheels turning. If you want to know more about any of these use cases or perhaps explore some other ones, feel free to reach out to our team.