A Distributed view of Application Performance Monitoring doesn’t have to be an expensive endeavor. There are ways, on most networks deployed today, to gain insight into hop-by-hop latency, packet loss, retransmits, jitter, and many other application performance metrics. You simply need to know how to look for it.
Introducing Cisco AVC
Gaining this type of insight doesn’t have to mean new hardware or even deploying expensive-to-maintain-network-performance-probes. If your company has Cisco routers deployed, upgrading to the latest IOS and taking advantage of Cisco Application Performance Monitoring (Cisco AVC) will allow you to export these new NetFlow/IPFIX exports. If you can do this with sFlow, please point me to the URL as I haven’t seen it.
Application Performance Monitoring
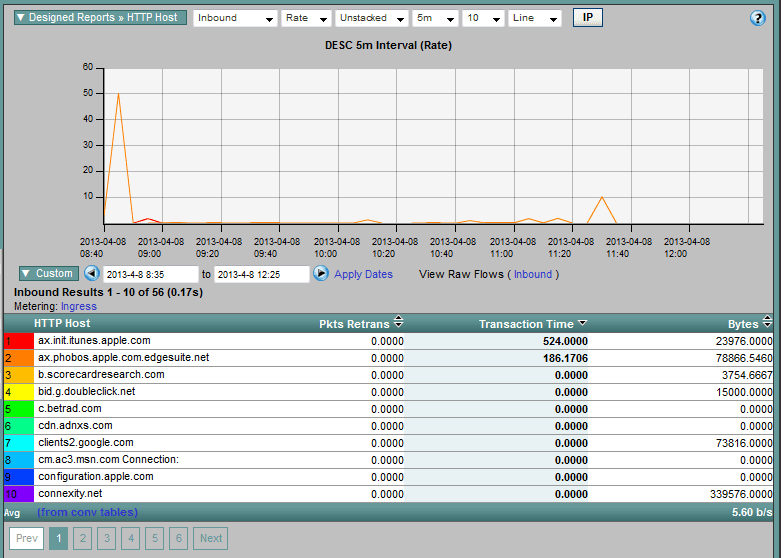
You should know that these new NetFlow exports from Cisco are actually sent with IPFIX (aka NetFlow v10). IPFIX is the official standard for all flow exports and opens up the technology to other vendors and empowers them to export unique metrics. IPFIX made provisions for variable length strings, which means Cisco AVC can export HTTP Host details. Imagine obtaining information on how much Internet bandwidth is consumed by facebook, linkedin, salesforce or even itunes. Cisco AVC exposes it all, and you can drill in on these domains to find out which internal users are utilizing these web sites the most. Better than ever, Cisco AVC allows admins to see on a hop-by-hop basis. This allows users to determine where the latency, packet loss, retransmits, etc. were introduced for a connection to a specific web site or layer 7 application such as webex, citrix, skype, etc.
Track BYOD Traffic
Cisco AVC also provides nearly 100% of the communication details of all BYOD devices. The latest flow exports from companies such as Citrix, Cisco, Dell-SonicWALL and nProbe all provide details that are similar to Cisco AVC metrics. It is all done without requiring a packet analyzer. Using these exports, combined with a next generation NetFlow and IPFIX Analyzer, you can determine why BYOD users are experiencing slowness. IPFIX and NetFlow reporting can deliver the details needed to isolate the root cause of a slowness problem fast and on a hop-by-hop basis. For these reasons, today’s next generation flow exports can be used as a distributed application performance monitoring solution for anything utilizing the corporate network.
The Gartner Group
“Unfortunately, at just the moment when executives have become keen about imposing an application-centric view of the world on IT operations, applications have become far more difficult to monitor; in general, architectures have become more modular, redundant, distributed and dynamic, often laying down the particular twists and turns that a code execution path could take at the latest possible moment. ”
Analyst(s): Will Cappelli, Jonah Kowall source
See the publication calendar for Gartner Magic Quadrants
I wonder if Will and Jonah considered Cisco AVC when they revisited the work they did when plotting out the major players in the Magic Quadrant for Application Performance Monitoring. I’m not sure that consumers of off-the-shelf software should be responsible for “Component deep-dive monitoring”. Some Application Performance Monitoring professionals would argue that the individual application vendor (e.g. Salesforce.com) should be responsible for trouble shooting at that level. Please share your opinion.