VMware NSX IPFIX provides network monitoring data similar to that provided by physical devices, giving administrators a clear view of virtual network conditions.
In a nutshell, VMware NSX does for the network what ESX does for the virtual server infrastructure. VMware NSX virtualizes the network, allowing the network administrator the ability to decouple the network from physical hardware. This makes it very easy to grow and shrink the network as needed, as well as making the network transparent to the applications traversing it.
Using NSX IPFIX in a virtualized network the network administrators gain visibility into the virtual overlay network. VXLAN IPFIX reporting using Netflow enabled on the host uplink provides visibility on the VTEP that is encapsulating the packet, and the details of the Virtual Machine that generated the inter-host traffic on a NSX Logical Switch (VXLAN).
The distributed firewall implements stateful tracking of flows. As these tracked flows go through a set of state changes, IPFIX can be used to export data about the status of that flow.
** The tracked events include flow creation, flow denial, flow update and flow teardown. As of this publication, the denied events are exported as syslogs.
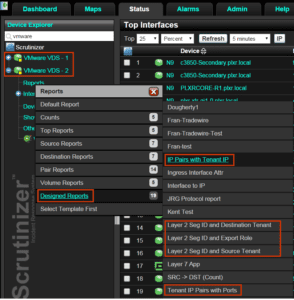
Whether you are receiving NSX IPFIX flows from the virtual distributed switch or the distributed firewall, administrators benefit greatly from the enhanced report visibility into the virtual environment. They can report and filter on things like the VXLAN tags, the virtual tenant hosts, and the port group ruleID’s.
Just take a look at the unique reporting options that become available from these rich IPFIX flow exports.
Pretty Cool!
Enabling IPFIX for a NSX Logical Switch is a three-step process.
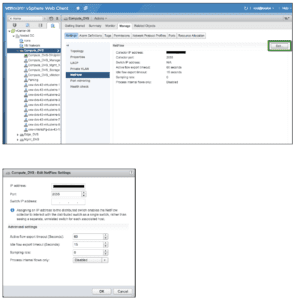
The first step – configure a Netflow Collector on the VDS backing the NSX Transport zone (Logical Switch).
Access your vCenter using vSphere Web Client and browse to Networking
Select the VDS that is part of the Transport Zone. Browse to Manage -> Settings -> NetFlow
Click on Edit to add a NetFlow Collector and set export timeout values.
A couple of things to note:
- A sampling rate of 0 (default) collects data from every packet.
- Enabling Process internal flows only – collects data only on network activity between virtual machines on the same host. In most cases we will leave this option set to Disabled which captures flows that are between VMs on different hosts.
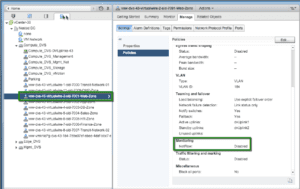
The second step – enable NetFlow monitoring on the dvPortGroup corresponding to the Logical Switch.
Browse to and click on a VDS port-group, select Policies and then edit to enable NetFlow Monitoring.
Note: If the NSX Transport Zone spans multiple VDS, then repeat these steps for each VDS/dvPortGroup.
Last step – enable NetFlow on the dvUplink. The steps to enable NetFlow on the dvUplink are similar to virtual dvPortGroup.
Browse to and click on the Uplink under the virtual switch, go to edit, and set Monitoring NetFlow to Enabled.
Enabling IPFIX on the Distributed Firewall
Steps to enable IPFIX flow export for Distributed Firewall involves enabling Global Flow Collection, Enabling IPFIX flow export and setting up IPFIX Collectors.
Browse to NSX Home -> Flow Monitoring. Click Enable for Global Flow Collection Status.
Once you click Enable Flow Collection, a new tab will appear for IPFIX.
Browse to the IPFIX tab and then click Edit to enable IPFIX flow export.
Enter Observation DomainID (valid range 0-65535) and Active Flow Export Timeout (usually 1 minute). Click OK.
To add a new Collector, click on the + symbol.
Provide Collector IP and UDP Port number.
Click Publish Changes to bring it into effect immediately.
Congratulations, you now have traffic visibility into your virtual network environment.
Network traffic monitoring using flow technologies to monitor communication behaviors, maintaining baselines, and detecting advanced persistent threats is becoming more relevant. Collecting IPFIX from the virtual environment offers yet another beneficial observation point.
As a network forensics and incident response system, IPFIX gives administrators access to all of the conversations traversing the network. When security professionals need to go back in time and view a communication pattern, they can find the flows that contain the conversations that they want to investigate.
Do you need more visibility into your virtual network environment?


