Latency or Round Trip Time (RTT) was first introduced by Luca Deri. Due to its popularity, several vendors including Cisco, Riverbed, Plixer and others have introduced it into their export. The reason for the popularity is due largely to the fact that we can’t always determine application slowness by considering utilization alone.
Slowness can easily occur even when all connections between end systems are underutilized. The cause of latency is usually consistent across vendors BUT, how the latency or Round Trip Time (RTT) metric is measured can change between vendors.
How Cisco Measures RTT
A TCP/IP hand shake relies on two known times with small delay to get close to the real RTT. In the diagram below, T1 is calculated from the time between the SYN (client) and SYN/ACK (server) passing the probe. T2 is calculated from the time between the SYN/ACK and ACK passing the probe. NOTE: the probe could be a router.
Client                    Probe                     Server

+-------+                 +-------+                 +-------+

|       |                 |       |                 |       |

|  SYN  +----------------->   +--++=================>       |

|       |                 |   |T1||                 |       |

|       |                 |   |  ||                 |       |

|       <- - - - - - - - -++--+--+<=================+ SYN/ACK

|       |                 ||  |   |                 |       |

|       |                 ||T2|   |                 |       |

|  ACK  +- - - - - - - - ->+--+   +----------------->       |

|       |                 |       |                 |       |

|       |                 |       |                 |       |

+-------+                 +-------+                 +-------+
Looking at just two packets gives you an accuracy that depends on where your probe is in the network. In this diagram we get only T1 and it only calculates the ‘RTT’ for the segment between the probe and the server. As a result, the accuracy of the RTT depends on application delay in the server and the placement of the probe. Placing the probe on (or very near) the client should give good numbers. Placing the probe on (or very near) the server will give unrealistically low numbers.
Client                    Probe                     Server

+-------+                 +-------+                 +-------+

|       |                 |       |                 |       |

|  Pkt  +------??--------->   +--++=================>       |

|       |                 |   |T1||                 |       |

|       |                 |   |  ||                 |       |

|       <-------??--------+   +--+<=================+ Pkt   |

|       |                 |       |                 |       |

|       |                 |       |                 |       |

|  ACK  |                 |       |                 |       |

|       |                 |       |                 |       |

|       |                 |       |                 |       |

+-------+                 +-------+                 +-------+
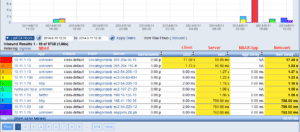
Below is an example of Cisco AVC support. The metrics were exported using IPFIX.

How FlowPro Measures RTT
Application Round Trip Time (ARTT) is derived from the IPFIX element flowDeltaMilliseconds_rev. This value is measured by observing the amount of time two hosts take to communicate with one-another. This is not necessarily an indication of network latency as some communications do not elicit an immediate response. For example, a mail server could initiate a TCP connection by sending a SYN and then 2 retransmits due to the lack of a SYN/ACK response. If the client eventually (e.g. after 40 seconds) sends an RST/ACK, that was how long that conversation took for the round trip. The ARTT measurement will be at least 40 seconds even if a ping response would have triggered a response in under 10 milliseconds. The same ARTT metric is also exported for UDP connections. For example, if a phone initiates a VoIP SIP connection and the PBX takes 56 milliseconds to respond, the ARTT will measure at least 56 milliseconds.
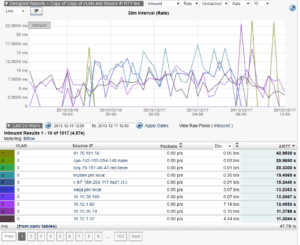
Below is an example of FlowPro exporting ARTT.

When a vendor tells you they export round trip time in their NetFlow or IPFIX export, be sure to ask them for a technical outline on how the metric is measured. Make sure you test it as well. Contact Plixer if you need help reporting on the metric with a new vendor.

