Once, the idea of knowing what applications are running on your network and knowing the application performance of each of them was only a want for administrators. Now, in the last few years especially, it seems that application performance has been on a growing trend, and Layer 7 application visibility is now a need and no longer a want. Applications have become part of everyday business some have even become mission critical meaning that we are reliant on that application performing efficiently at all times.
Where do we stand?
The issue that most administrators are faced with is some of their network devices are not capable of exporting metrics to calculate application performance, or provide the Layer 7 application visibility. A solution to this issue is by mirroring a port from one of these network devices to a NetFlow probe, like Plixer’s FlowPro APM, and you can begin to export these metrics to your NetFlow collector. Once you are streaming traffic to a probe, the APM converts the raw data into IPFIX that is then sent to the collector in the form of NetFlow. Imagine the possibilities, no longer do we need to wait for the next time the phone rings for that “my last call was very jittery” call. We now have the means to measure jitter as well as look at round trip times of applications where we normally would have had no insight.
Why is this important?
So one thing comes to mind is how is this information impacting your business, why does application performance matter? I stumbled onto an article a few months back that I found particularly interesting because it discussed the different reasons why application performance matters, and included quotes from admins in the industry. A snippet from one quote stood out to me “Slow is the new broke”, which I thought was quite on point with the growing trend in the industry. While these applications may be running non-stop in your environment, when latency occurs, it is felt throughout the entire network and impacts end user experience. Perhaps a slow application isn’t going to make all productivity come to a screeching halt; however, the impact on your employees to do they job efficiently is lost over time because of latency.
Application Performance and Visibility
It would make sense to set up a mirrored port from a core device perhaps that is seeing a majority of the network traffic, this way we are seeing the most we can off this mirrored port. When we have our probe linked to the device, we can then start collecting metrics and sending them to our flow collector. The image to the right is a dashboard view of just four reports that could be seen from the traffic coming from the FlowPro APM. We see Layer 7 Application Visibility on the far left report as well as measuring jitter and latency on the other windows. What can be learned from a dashboard view of these reports is what application are running on the network, how are they being tagged in regards to priority, and who is affected by latency on the network. All of this insight could be coming from a device that may not even be exporting flows.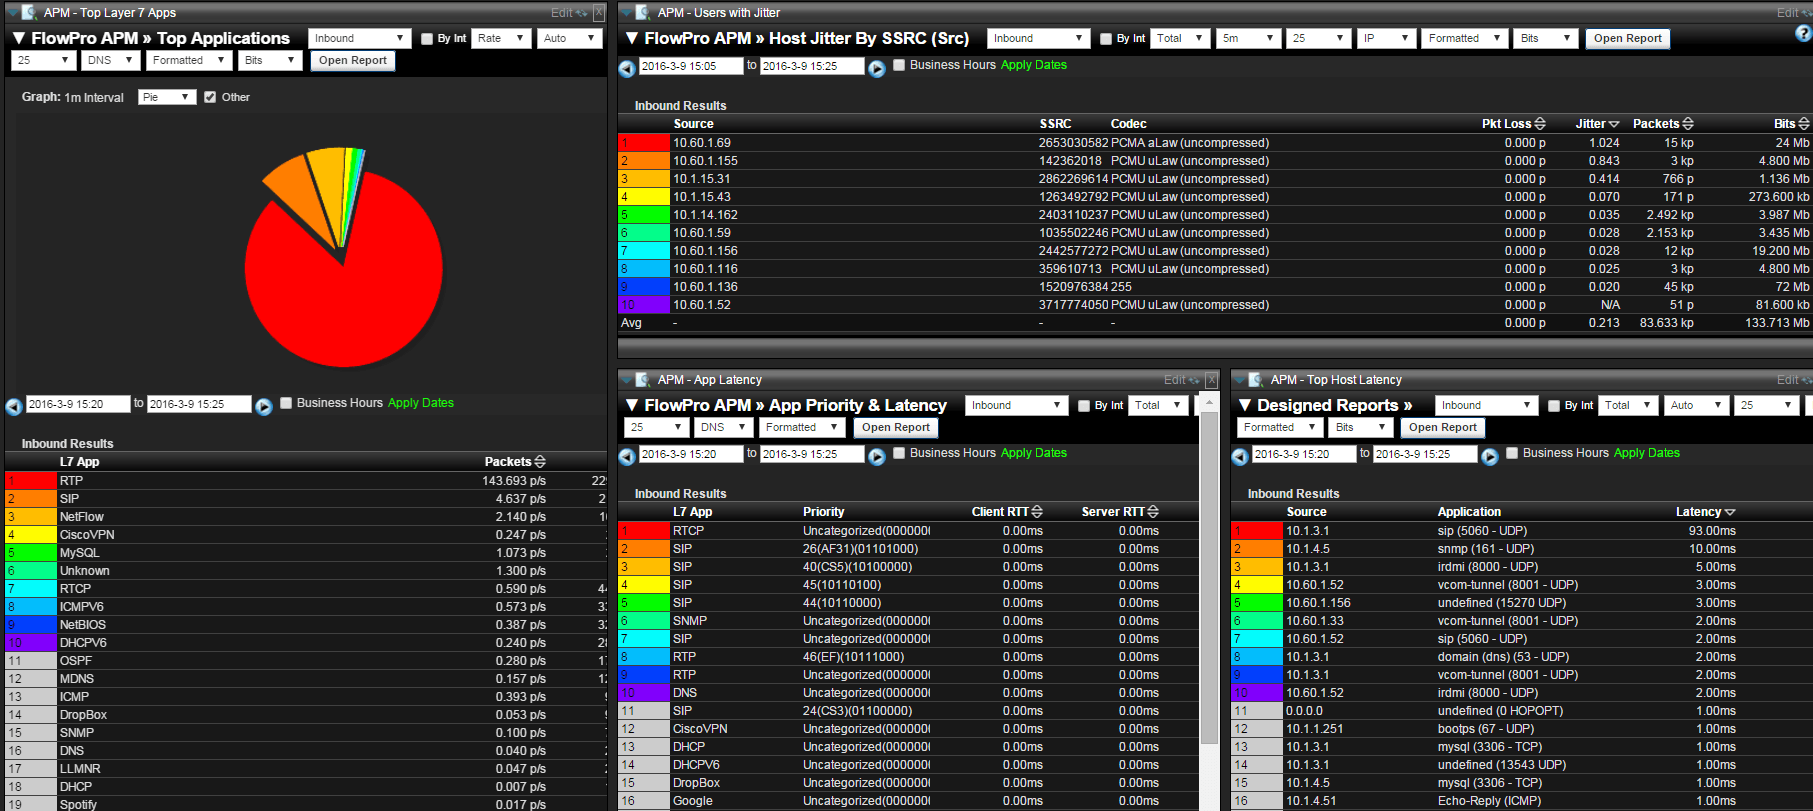
If you are looking for a means to gain app visibility into your network and tie back to performance, reach out to us at Plixer, we can help you achieve your goal.