
When we think about the world of Network Flow data, we usually think within Layers 3, 4, and 5. Typically IP addresses are as close to the endpoint as we get. Sometimes that is good enough, but more often some type of lookup or investigation must occur to figure out what that IP host is.
We all know that IPFIX can solve some of those problems as they can provide additional metadata such as MAC addresses or L7 application information. However, you must have an exporter that provides the IPFIX stream. For those that do, this is a great source of additional network data that can provide a lot of value. But when I talk about endpoint analytics, I’m going beyond IPFIX streams.
Endpoint Analytics is a Scrutinizer platform feature that is designed to discover, inventory, and track all network-attached endpoints—in real-time and without an agent. We do this by leveraging existing repositories of endpoint data that are already present within your network fabric. We can collect data attributes from these repositories through several techniques. Techniques such as IP Helper for DHCP exchanges, SNMP polling of -and SNMP traps from network switches for CAM/ARP tables, Endpoint information from Active Directory, RADIUS Accounting ingestion, network traffic (SPAN), DNS, and a bunch of others.
You’ll notice that none of these data collection methods I’ve mentioned involve any type of endpoint interrogation and all of them can be leveraged in an agent-free way. Good news for any critical infrastructure or manufacturing!
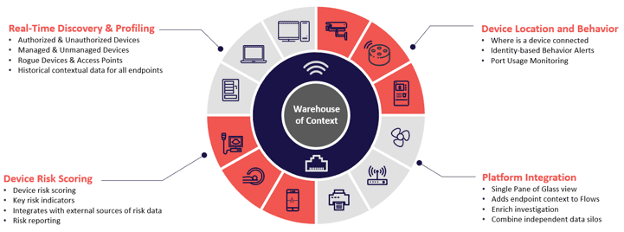
Once collected, the data is correlated into a Warehouse of Context where it is continuously leveraged to discover, identify, and profile ALL your endpoints in real time. Now you may not have or want to leverage all these data sources. And that is ok. Endpoint Analytics is designed to operate with as few or as many as you want.
This A la carte style data collection and lack of dependency on any one data collection technique is critical and provides a lot of benefits:
- Flexibility – No two networks are the same.
- Scalability -SPANs are great, but expensive.
- Comprehensive – looks at more than just a MAC address.
- Continuous – Not point in. Captures transient or misconfigured devices.
- Safe – Does not directly interrogating end devices.
Our endpoint Analytics records and analyzes the identity and behavioral attributes of endpoints on the network and uses these attributes to assign every device to a profile. Each profile is essentially, a logical container holding one or more endpoints with similar function, capability, or other defining attributes. Profile rules are used to determine which profile is the best match for each endpoint.
If you have seen our website, you know that we talk about Deep Network Observability. Now that you can see the endpoints and devices behind each IP address, this concept should start to make sense.
So, lets talk about other benefits this brings…
Endpoint Analytics identifies real-time events such as endpoints being added to the network, changes in identity or behavioral attributes of an endpoint, and detection of unwanted endpoints. When one or more attributes of a device change, Endpoint Analytics evaluates whether the change warrants an adjustment of the existing endpoint profile. If a change in profile is warranted, we transition the endpoint into the new profile, which can trigger a notification.
All of this data and context is available in a single solution. The endpoint profiles and relevant endpoint attributes get displayed in our endpoint analytics tab within Scrutinizer. This allows you to efficiently tie endpoint context to network traffic. Did you identify a top talker? Or maybe a bandwidth hog? Have you ever found yourself parsing through router MAC-Address tables trying to find where a device was located? This eliminates that by providing you with the MAC address, profile, VLAN, and switchport location (or for wireless devices, access point and SSID). It can really save you a lot of time.
When you look through many of the cybersecurity standards or frameworks out there, whether its Center of Internet Security’s top 20 Critical Security Controls or the NIST standards, network visibility really is a foundational piece to any good security plan.
On top of this, seeing as we have access to all these endpoint attributes it makes sense to provide a risk-level perspective.
- We have profiled these devices so we have an idea of how they should (or more importantly – should not) behave.
- For many devices, we can detect their OS and OS version. If it is an older or no longer supported version, that poses a higher risk.
- Integrates with external sources as well. Microsoft Defender and Tenable can each feed us endpoint risk data and we can reflect that in our scores.
And of course, it would only make sense to be able to provide reports that can help identify what your riskiest devices are. Or provide indicators during an investigation on where to focus your attention.
Earlier I mentioned most of this information was available in the endpoint analytics tab within the Scrutinizer Platform. For those of you who haven’t seen it, I thought I would take a moment and show you what it looks like…
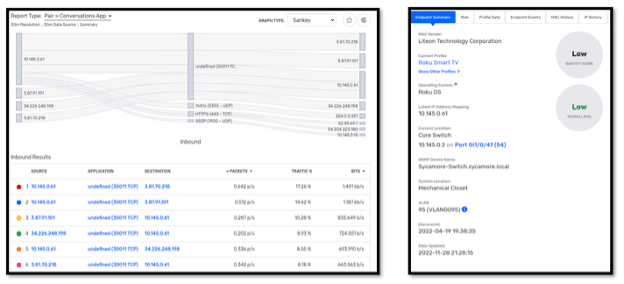
On the left you’ll see a Sankey graph showing traffic to and from an internal host. As part of an investigation, it would really help to know what this host is. Unfortunately, it has no DNS entry and resides within a Dynamic IP range, so figuring it out could be a bit tricky. Fortunately, Endpoint Analytics has already done the work for us. It has identified this device as a Roku Smart TV. It has told us where on the network it is connected, the first time it was connected, what operating system it is running as well as a derive a risk score.
Additionally, you’ll notice along the top there are additional views that will dive into more details such as
- Risk (breaks down the risk and shows me why it scored the way it is)
- Profile data (which is the raw attributes we are seeing)
- IP history (which tell me other IP addresses this device has had over time.
So hopefully that was informative. Personally, I think it’s cool that we are pulling in all these endpoint attributes into a world that primarily operates at Layers 3 through 5. If you want to know more about any of these use cases or perhaps explore some other ones, feel free to reach out to our team.