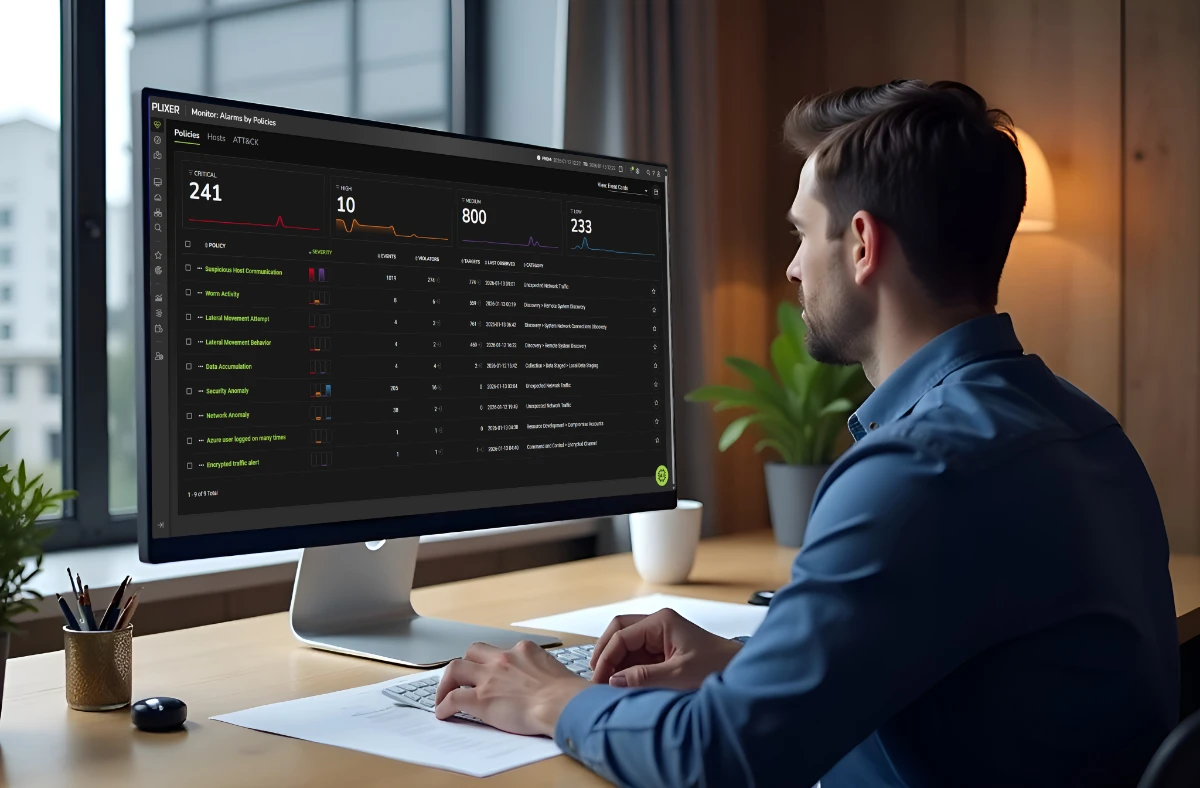
Flow-based network performance monitoring
Network performance monitoring that tells you what’s slowing your network down
Your network already exports the data. Plixer tells you what it means.
Plixer collects the network flow your routers, switches, firewalls, and cloud platforms can export. When something slows down, you can see what changed, where it changed, and who it hit.
What it is
What is network performance monitoring?
Network performance monitoring (NPM) is how network teams find the cause of slowdowns and outages, fix them before users feel them, and prove what happened afterward.
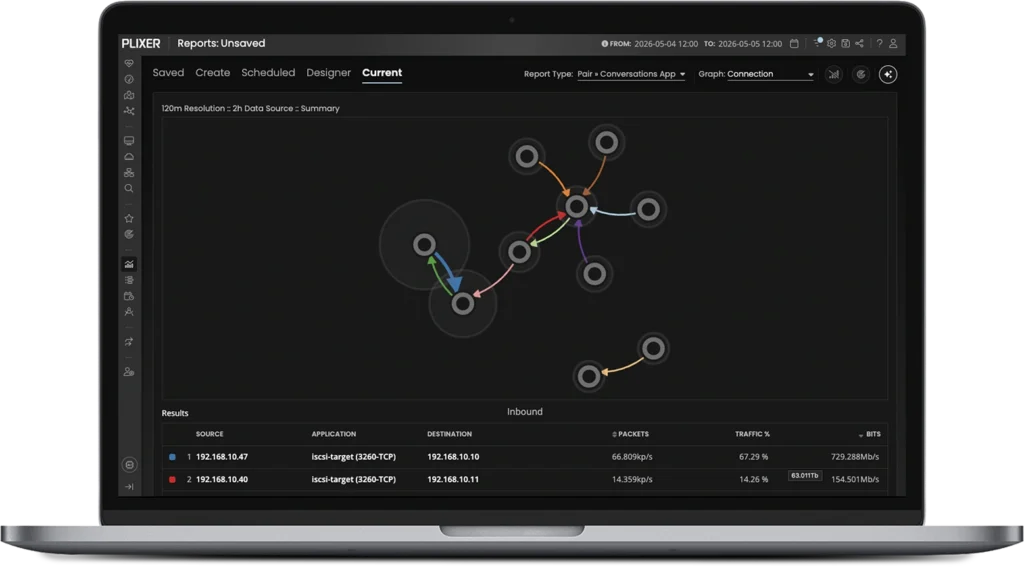
Some tools poll each device and report on its condition. Plixer starts from network flow: the records your devices can export about the conversations that cross them. Flow tells you who talked to whom, over which path and port, for how long, and how much data moved. That’s how you answer why it’s slow.
Questions Plixer answers
What can network flow tell you that an alert can’t?
An alert tells you something is wrong. Flow tells you what, where, and why. These are the questions that land on network teams every week, and where each answer comes from.
Why is this application slow at only one site?
What you can do
Compare traffic, paths, and interface utilization at that site against the others.
Using
What caused yesterday’s bandwidth spike?
What you can do
Go back to when it happened and see which hosts, applications, and conversations drove it.
Using
Is the delay the network or the server?
What you can do
Separate network delay from client and server delay with packet-level measurements.
Using
Why are calls choppy at one location?
What you can do
See where latency, jitter, and packet loss begin across the network.
Using
How is our cloud traffic changing?
What you can do
Report AWS, Azure, Google Cloud, and Oracle Cloud flow logs next to on-prem traffic.
Using
Did last night’s change fix it?
What you can do
Compare before-and-after performance on the same links and applications.
Using
When will we need more bandwidth?
What you can do
See saturation coming before users feel it.
Using

Troubleshooting
What changed when it slowed down?
The hardest problems are the intermittent ones. By the time someone opens a ticket, the moment has passed. Plixer keeps a searchable history of network flow, so you can go back to the moment it started and find the cause.
You decide how much full-detail flow data to keep and for how long, on storage you control.
Most tools decide for you when detail gets rolled up. Plixer makes it your decision.
- Top talkers, applications, and conversations by interface, site, or time window
- Path views across routers, switches, firewalls, and cloud gateways
- Interface utilization trends compared against historical baselines
- 500+ customizable dashboards, reports, and integrations
Application performance
Is it the network or the application?
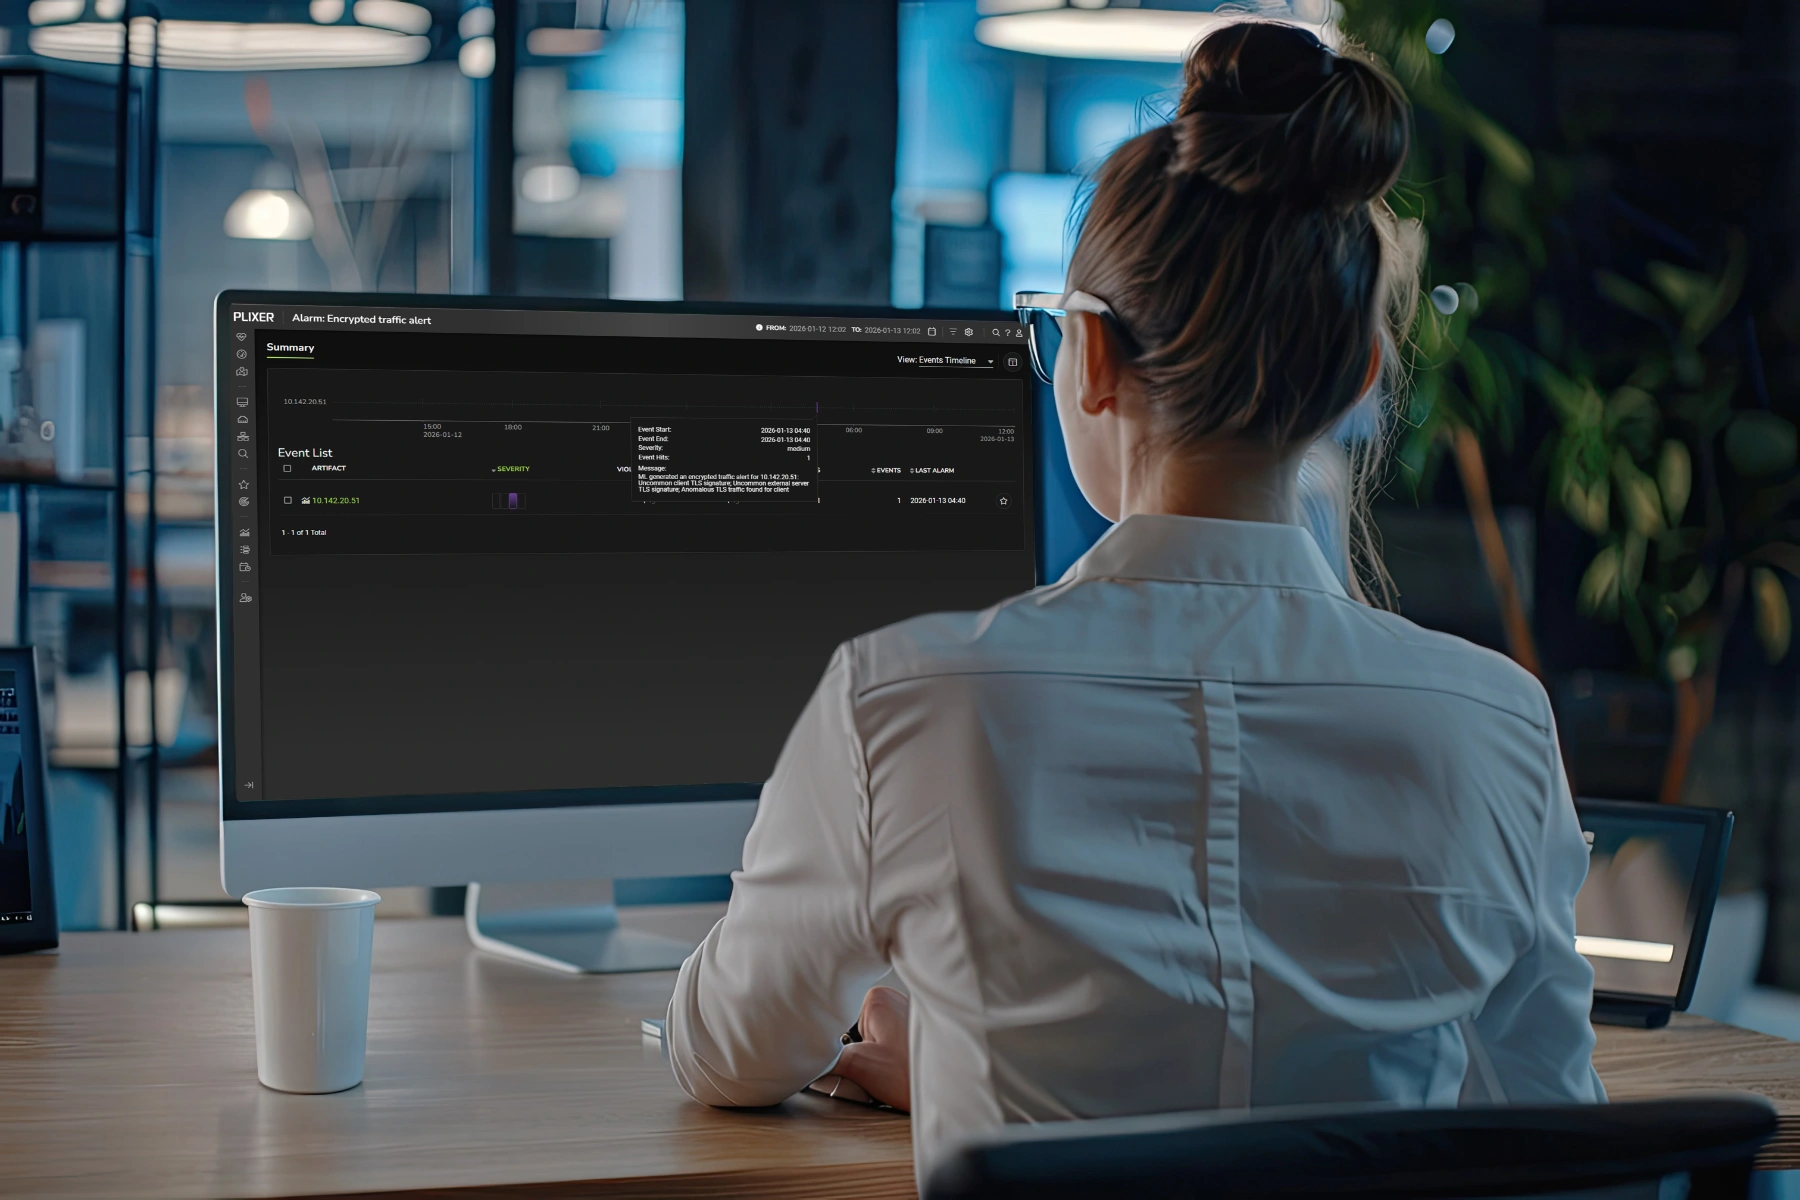
That’s usually the first argument when users start complaining. Plixer FlowPro helps answer it. It measures latency, retransmissions, and application response times in live traffic, then correlates them with network flow in Plixer One. You can tell whether the delay is in the network, the server, or the application, without installing agents on endpoints.
Explore Plixer FlowProCapacity planning
Will this link run out of room before the next budget cycle?
Plixer forecasts utilization from your own flow history and flags links heading toward saturation. When it’s time to ask for a circuit upgrade, you have the trend line to back it up. Forecasting comes from the Plixer Machine Learning Engine, which runs on the network flow Plixer already collects.
Explore the Plixer Machine Learning EngineWhere Plixer fits
Do you need to replace your current monitoring tool?
No. Most network teams already run a tool that polls devices and alerts when an interface goes down or a CPU spikes. Keep it. Plixer isn’t built to manage devices, and it doesn’t change configurations on your routers and switches.
Plixer picks up where those alerts stop. When an interface is saturated, network flow shows who filled it. When one site says the app is slow, flow shows what changed at that site and when. Plixer Scrutinizer does poll SNMP, but only to add interface context, like names and speeds, to the flow data. It doesn’t handle device availability alerting.
What each part of Plixer covers
| What you need to measure | Where it comes from | Included in |
|---|---|---|
| Traffic volume, top talkers, and conversations | Plixer Scrutinizer (network flow) | Every edition |
| Paths and interface utilization | Plixer Scrutinizer (flow and SNMP) | Every edition |
| Cloud traffic (AWS, Azure, Google Cloud, Oracle Cloud flow logs) | Plixer Scrutinizer | Every edition |
| Application, client, and server latency | Plixer FlowPro | Plixer One. Add-on for Plixer Scrutinizer. |
| The user and device behind each IP address | Plixer Endpoint Analytics | Plixer One. Add-on for Plixer Scrutinizer. |
| Behavioral anomalies and capacity forecasts | Plixer Machine Learning Engine | Add-on for every edition |
| Device up/down polling and configuration management | Your existing monitoring tool | Not part of Plixer |
Plixer AI
What if your alarms were sorted before your team logged in?
Plixer AI works the alarm queue overnight. It ranks alarms by risk and impact, points to the likely cause in the flow data, and writes an initial incident brief. Your team starts the day with the first look already done.
Meet Plixer AI
Customer story
How did First National Bank of Pennsylvania get to 50% faster resolution?
The bank has 300 sites and 4,500 employees, and its old monitoring tool kept only 48 hours of data. After moving to Plixer, the network team resolves issues significantly faster and can look back well past two days. On price alone, the switch saves the bank $32,000 a year.
50%
Faster time to resolution
$32K
Saved per year compared to its prior tool

Keep reading
Learn more about flow-based performance monitoring
Network performance monitoring FAQs
What is network performance monitoring?
Network performance monitoring (NPM) is how network teams find and fix the cause of slowdowns. Plixer does it from network flow, the records your devices can export about the traffic that crosses them.
How is flow-based monitoring different from SNMP polling?
SNMP polling asks each device about itself, like whether an interface is up or how busy it is. Network flow describes the traffic: which hosts and applications were talking, and how much data moved. Polling tells you a link is busy. Flow tells you why. Plixer works alongside the polling tool you already have.
Which devices can export network flow?
Most enterprise routers, switches, and firewalls can export flow in formats like NetFlow, IPFIX, and sFlow, once it’s turned on. AWS, Azure, Google Cloud, and Oracle Cloud produce flow logs too. Plixer’s setup guides cover common vendors.
Do I need to deploy sensors or agents?
Not to get started. Plixer Scrutinizer works from the flow your devices and cloud platforms can export. Add Plixer FlowPro where you want packet-level detail, with no agents on endpoints.
How far back can I search?
By default, Plixer Scrutinizer keeps a year of searchable history for every host it sees, counted from the last time each host appeared. Separately, you decide how much full-detail flow data to keep and for how long, on storage you control.
Does Plixer cover cloud and hybrid networks?
Yes. Plixer reports on AWS, Azure, Google Cloud, and Oracle Cloud flow logs next to your on-prem traffic.
See Plixer on your own network
Bring a performance problem you’re chasing right now. Every evaluation includes a live demo with a sales engineer and a proof of concept in your environment.