Did you ever consider that using Flexible NetFlow, specifically an NBAR NetFlow configuration, could provide another aspect of network security for you?
Exporting NBAR (Network Based Application Recognition) in Flexible NetFlow records provides the opportunity for deep packet inspection visibility in NetFlow reporting. Once you have that visibility, you’re just a half step away from also using that information for detecting unwanted traffic on your network.
It may be malicious traffic, or it may be someone abusing your network resources, such as watching Youtube videos or NetFlix during the business day, consuming valuable bandwidth.
So how do you get this application information in NetFlow, you ask? Well, read on, and I’ll tell you how.
There are 4 basic steps:
- Create the Flexible NetFlow record
- Create an Exporter
- Create a Monitor
- Apply the Monitor
In this sample NBAR NetFlow configuration, we first define the flow record. The ‘match’ statements are your key fields and define the tuple. The ‘collect’ statements are used to add whatever other information you want in the record. So you ‘match’ statements are the elements that are ‘matched’ to define a conversation, and the ‘collect’ statements are for the additional data you want to ‘collect’.
How nice of Cisco to make that logical for us.
!define flow record
flow record NetFlow
match ipv4 source address
match ipv4 destination address
match transport source-port
match transport destination-port
match ipv4 protocol
match input interface
match ipv4 tos
match flow direction
collect output interface
collect counter bytes long
collect counter packets long
collect routing source as
collect routing destination as
collect routing next-hop address ipv4
collect transport tcp flags
collect ipv4 dscp
collect ipv4 ttl
collect ipv4 source prefix
collect ipv4 destination prefix
collect timestamp sys-uptime first
collect timestamp sys-uptime last
collect application name
** Please note that match input interface and collect output interface may have different syntax in your IOS version, for example:
match interface input
collect interface output
Next we are on to defining the exporter. This is where we say where we will send the flows to, using what transport port, and what the source interface will be (the door that the flows are sent out through). There are also timeout settings and option templates that can be included in the exporter definition.
!define exporter
flow exporter Export-to-Scrutinizer
destination x.x.x.x !Scrutinizer’s ip address
source XXXXXXX !interface name
transport udp 2055
template data timeout 60
option interface-table
option application-table
The monitor brings all of this together, what exporter definition you will use, and what flow record to export, and the active timeout setting – very critical!
!create monitor
flow monitor Scrutinizer-monitor
record NetFlow
exporter Export-to-Scrutinizer
cache timeout active 60
Last step is to apply the monitor to each interface that you want to monitor flow data for. Applying as an input AND an output configures for both ingress and egress metering.
!Apply ingress/egress monitors to an interface
interface XXXXXX !interface name
ip flow monitor Scrutinizer-monitor input
ip flow monitor Scrutinizer-monitor output
That’s it! That completes the basic Flexible NetFlow NBAR configuration.
So what do you get with NBAR reporting? Here’s an example report showing a summary of applications traffic by name and their respective traffic volumes. This could be taken a step further by clicking on an application, such as youtube, and displaying what host IP Address was generating the youtube traffic.
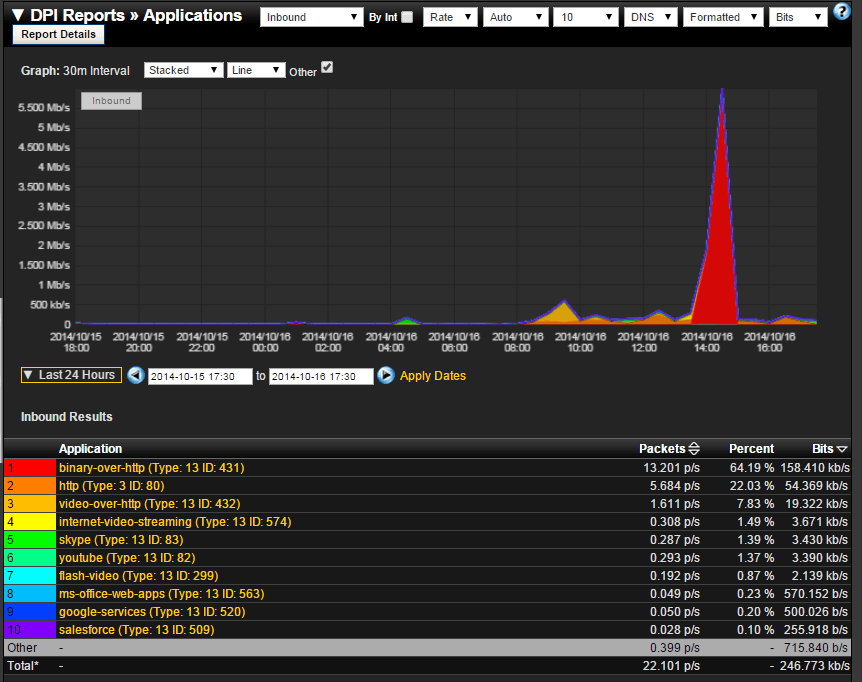
With this application level reporting, you’ve got a good start towards isolating unnecessary or unwanted network traffic from the legitimate traffic, and also potentially malicious or illegal – such as bittorrent traffic.