Network Maps provide end-users with a high-level view of what their network topology looks like, as well as how traffic is flowing through your network. Most commonly, I see them used as a quick reference to determine if there’s any link saturation happening. What if we were to combine mapping functionality with some of the unique elements exported in flow data today?
Today, I would like to walk through the process of creating network maps in Scrutinizer, as well as look at a few unique examples that end users can take advantage of in their environment.
Designing Your Map
The first step is deciding what type of map we want to create. To start with, I’ll create a simple network overview. We’ll start on the Maps tab and select the ‘New’ option on the left-hand side. First, we have to decide which map type we want to create. We can create an ‘html5,’ ‘Plixer map,’ or we can leverage Google maps (note that the Google maps will require an API key that’s free to obtain). For my overview, I chose a Plixer map.
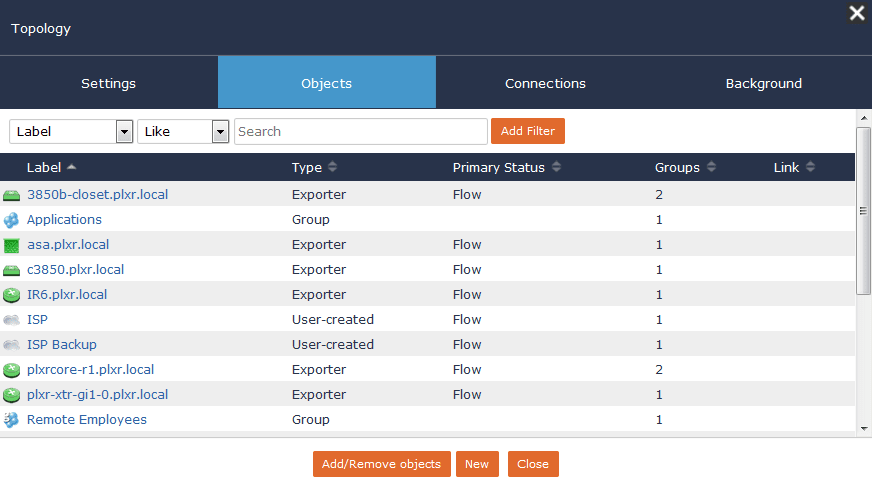
Next, we need to include our devices as objects. As you can see in the screenshot below, objects aren’t restricted to only networking devices. In my topology map, I’ve included objects to represent our ISP, as well as child maps nested within the topological view.
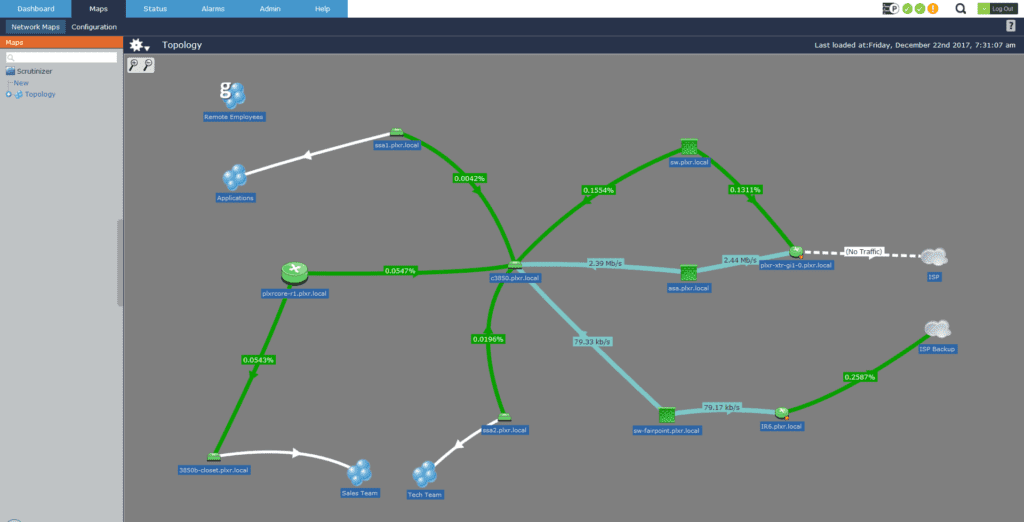
Once we have our objects included, the next step is to create connections. This is done via the connections tab, and the connections provide options on how to represent these connections. Most of the connections I’ve made are on the physical interfaces that connect each device. This allows me to view the traffic volume passing through devices as a rate or percent utilization. I’ve also made logical connections to my nested maps off the device they connect up to.
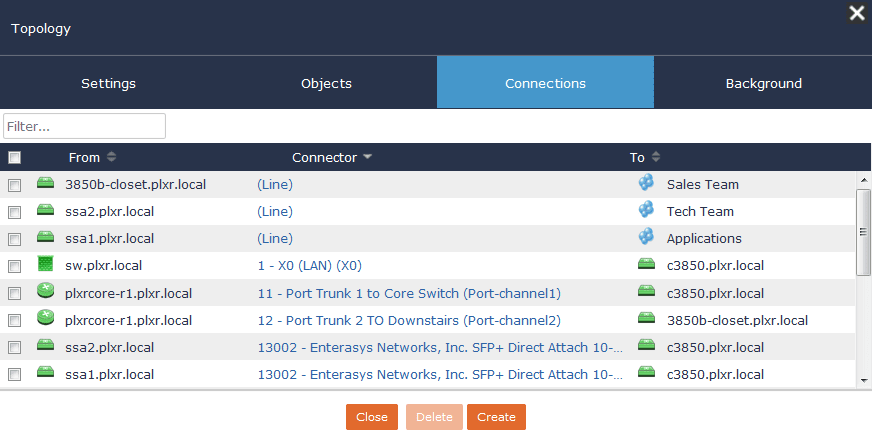
The benefits of the connections are two-fold: they give a real-time utilization of our links and also allow us to drill in and look at the conversations taking place.
Nested Maps
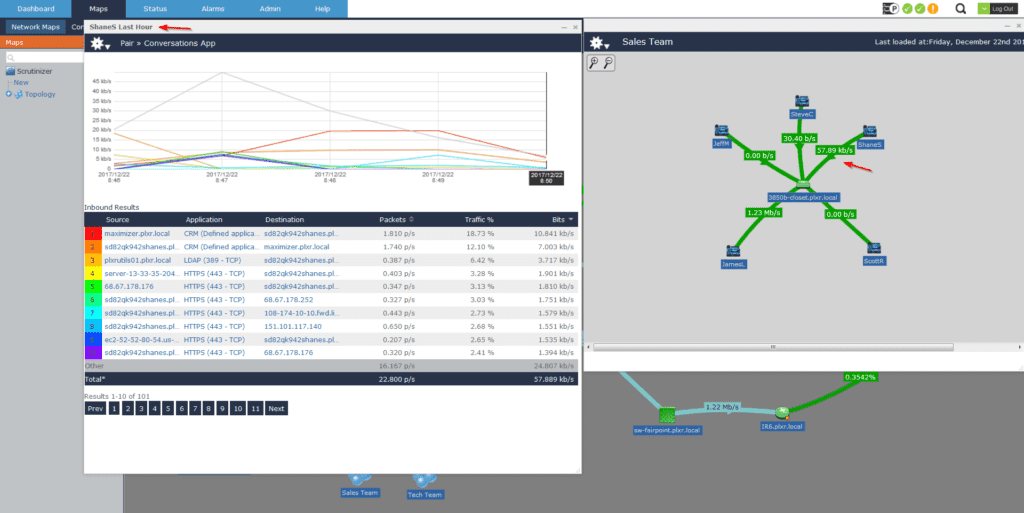
Let’s drill in on the ‘Sales Team’ map. From our topological map, we zoom into just our sales department by clicking on that map:
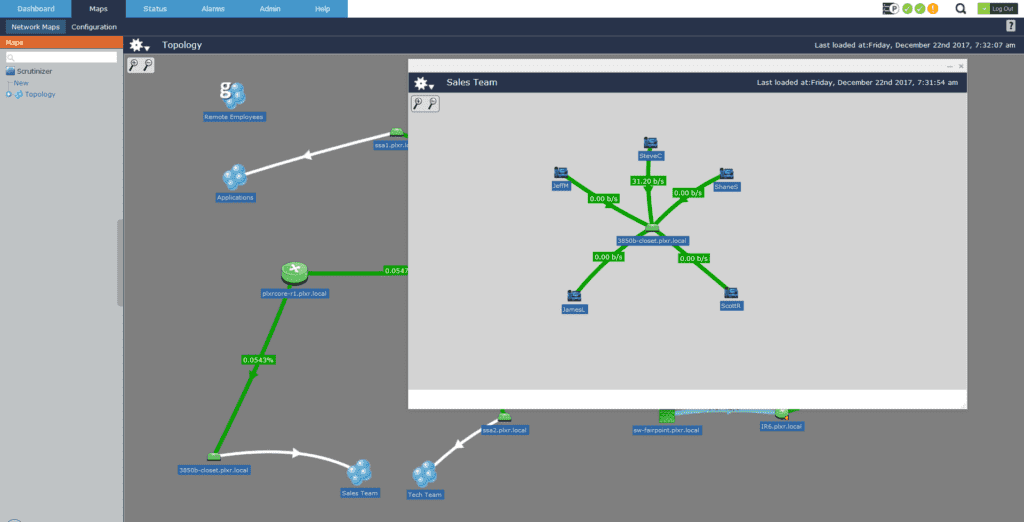
Here, I created a map representing a couple of your sales team members. What’s unique about this map is that each connection linking back to the 3850 is a custom report filtered only on that user’s traffic. From here I can gauge how much traffic each user is consuming. Another common use case here is monitoring VoIP traffic rather than a user’s volume.
First, let’s look at how these connections were made. I started by creating a report that isolates a user’s traffic:
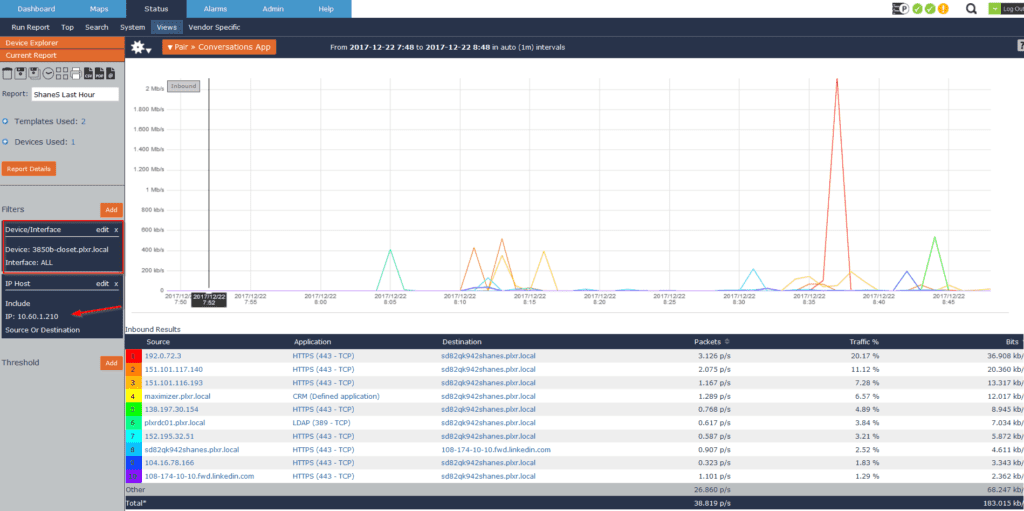
I then used this report to connect the object ‘ShaneS’ to the 3850 switch. Now from the Topology map, I can drill into the Sales Team, where I can monitor each specific user.
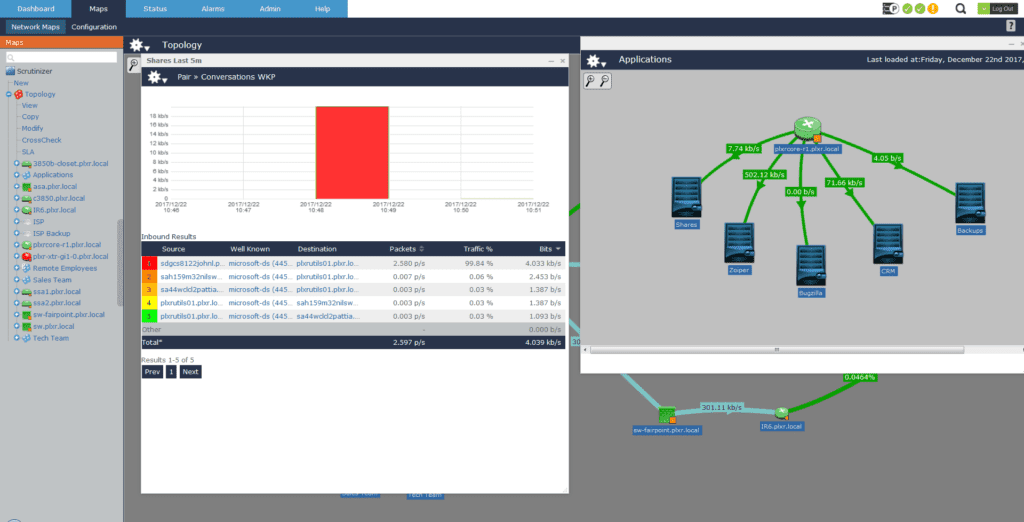
Let’s pivot from our user traffic to monitoring our application servers. From the Topology map, you can see I’ve created a nested map for our application server. Similar to how we created our Sales team map, I utilized an object to represent our application servers and then made a custom report isolating that specific application traffic.
In my time on the support team, I saw quite a few unique maps specific to end-user’s environments. Since no two environments are the same, it’s a nice benefit to have the flexibility of defining which traffic I’m concerned about.
If you have any questions on mapping functionality, don’t hesitate to contact our support team, or schedule a product overview here.
Also head on over to our Youtube channel plixerweb where you can view many quick tip videos, including a walkthrough on creating maps.