Are you looking to report on Cisco QoS Queue Drops? Before I explain how to do this, keep in mind that this feature is supported on ISR-G2 with Performance Agent, starting from IOS 15.2(4)M2. Now, if you’re new to QoS Queue Drops and don’t understand why someone would want to report on this, read on.
Cisco Queueing Hierarchy
Sometimes referred to as congestion management, queuing mechanisms map how traffic from multiple streams is sent out of an interface that is currently experiencing congestion. Cisco allows the router administrator to configure a policy map hierarchy. Each policy map can consist of up to 8 (0-7) Classes and each class contains a name (e.g. RTP) as well as a priority (e.g. EF). These classes end up correlating directly to the queues on each interface of the router.
Cisco Queueing Logic
When a router is receiving traffic faster than it can be transmitted, the device attempts to buffer the extra traffic until bandwidth is available. This buffering process is called queuing. You can use queuing mechanisms to influence the order that various traffic types are emptied from the queue.
Each queue should have its own unique ID. The same queue name can exist on multiple interfaces however, the unique queue ID per interface must stay unique for the entire router.
To reiterate, a router has up to 8 queues in which traffic can be assigned. They range from high priority to best effort. The diagram below shows 4 queues. Eight are available (numbers 0-7) but, they don’t all have to be assigned.
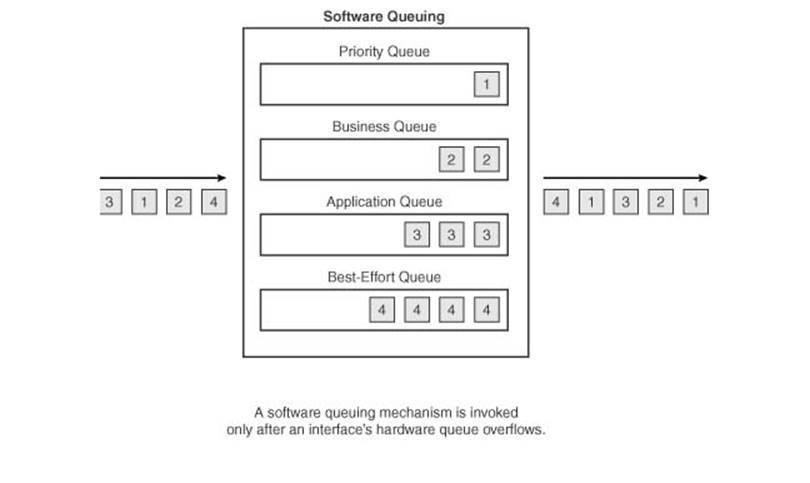
Cisco uses CBQoS. This means queues are assigned based on traffic classes which are then placed in a policy-map with the configuration of the QoS metrics you want (RTP – EF). This tells the router what traffic belongs in what queue. The policy mapping is then applied to an interface much the same way a Flow monitor is in a Flexible NetFlow configuration.
Obviously the priority queues get the love when things get congested. When a queue becomes full and cannot forward a packet fast enough, packets at the end(tail) of the queue are discarded. These are known as “tail drops” or “queue drops” and this is what we want to measure and trend.
What the Queue is going on?
Queue drops are telling you:
- If your queuing policy is dropping low priority traffic when congestion is experienced.
- If you have made a mistake in estimating queuing resources. As a result, you may need to change your policies to meet your QoS goals.
- If something is terribly wrong and you need to upgrade something.
Keep in mind that these interface queues on the router fill and empty within microseconds. For this reason, monitoring the level of the queue is not helpful because you can’t get an accurate reading by taking snap shots. The best way to gauge success of the queues within the policy mapping is to monitor the packet dropped counts.
The Relationship of QoS Queue Drops and Flows
So this is where things get a little interesting in a flow export. You can have many different flows representing different applications inside of a traffic class. This mishmash of traffic all belongs in a queue. The router can ONLY track how many packets it is dropping in a queue. It cannot record the exact flows the packet drops belonged to. This is why there needs to be two separate flow caches when logging queue drops.
Cisco QoS Queue Drop Configuration
!this counts the drops in each queue. You cannot configure any other
!fields for export in a queue drop record.
!It will fail when you go to apply it to the interface.
flow record type performance monitor qos-record
match policy qos queue index
collect policy qos queue drops

!this is a record that gives you info as to what traffic is in what queue.
!It can be a regular Flexible NetFlow (FnF) record.
!This is just to show a simplified record.
flow record type performance-monitor qos-class-record
match connection client ipv4 (or ipv6) address
match connection server ipv4 (or ipv6) address
match connection server transport port
collect policy qos class hierarchy
collect policy qos queue id
To reiterate: You cannot count queue drops on a per-flow basis. Multiple flows can be in the same queue at the same time. As a result, it would not make sense to have a queue drop report with a corresponding source IP address or application as they would be reporting the same drops in different rows.
In the exporter, the two C3PL templates (shown below) act as a decoder ring for the class hierarchy information. This also provides user friendly names in the QoS reports.
What Does Cisco Export?
From the Wiki page : The queue statistics that are exported will be the drops seen due to the queuing action configured under a class-map. These drops will be collected per export interval from the queuing feature and will be exported in a separate option template table. This option template table will identify the drops seen for a particular queue id, and the flow record will identify the id of the queue that a flow was queued in. As we’re exporting the drops at a queue level, the drops seen under a queue will be a summation of the drops experienced by multiple flows that matched on the same class-map hierarchy. FNF export ID 42129 would be used for this metric. It is supported by netflow-v9 as well as IPFIX.
Cisco QoS Queue Drop Templates
We can export 2 different templates. One is the PA “flow” data (shown below):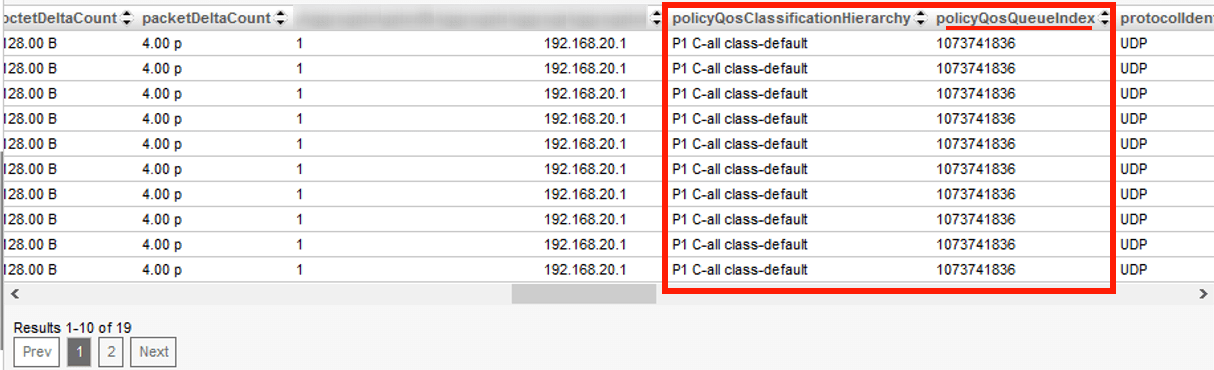
Again, the reason for this is that AVC will not give you per-flow queue drops. It will tell you what queue and c3pl map and queue id you belong to and it will separately tell you the number of drops in a queue for a specified interval.
Cisco Queue Drop Reporting
By using the queue ID and the timestamp, we can infer per class(c3pl) hierarchical queue drops.
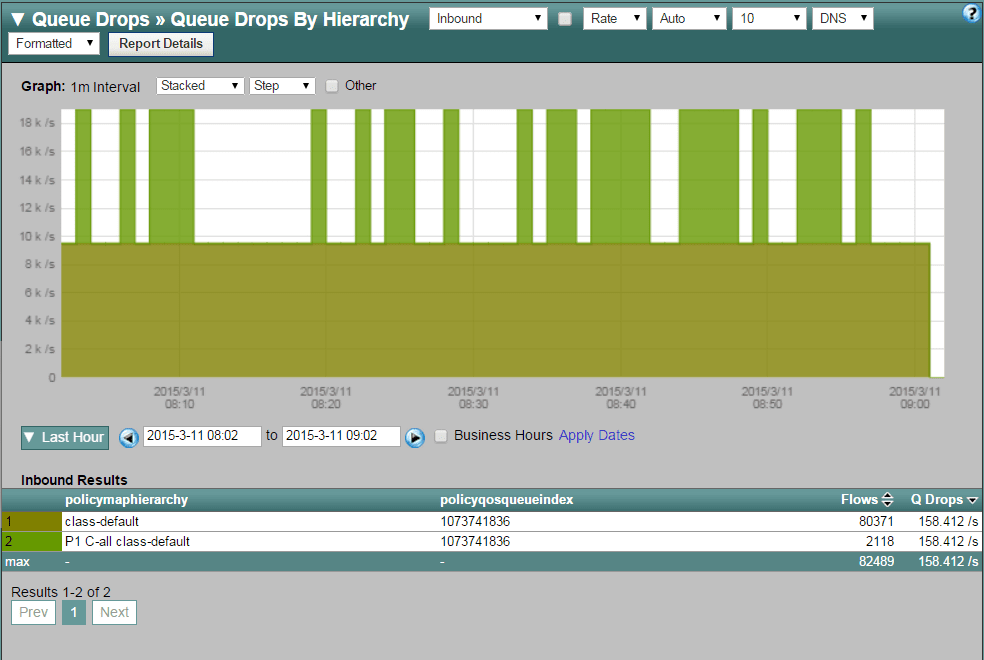
FOR THE LAST TIME! It is not possible to directly correlate a dropped event with a specific flow. Queue drops is a single counter representing all of the traffic that passes through the same queue. However, queue drops is an extension of performance monitoring and MACE which also allows you to report on re-transmits per flow.
If you need help setting this up or if you would like to test our reporting on Cisco queue drops, please reach out to our team.