
Today I would like to explain how to create a custom script that sends specific information to PRTG as a sensor. Customers often ask me how to use PRTG to tack the uptime and downtime of Scrutinizer. So, what specific parameter needs to be set up so that the PRTG sensor would react immediately on it?
The first thing to know before we start is that Plixer Scrutinizer is a CentOS-driven application. In addition, before proceeding through this guide, please have an SSH connection managed in advance or a console connection. Once you have a session running, our first step will be creating a CronJob, which should be set up to be triggered every 5 minutes:
crontab –e
#############################################################################################
*/5 * * * * export PGPASSWORD=root; psql plixer -c 'select extract(epoch from now())::INT - max(last_flow_ts) as keepalive from plixer.exporters;' -t > /var/prtg/scripts/keepalive.txt
#############################################################################################
The above command sends an output to a keepalive.txt file every 5 minutes.
We will also have another script created and named prtgsh.sh, which should include the following:
################################################
#!/bin/bash
if [[ $(cat /var/prtg/scripts/keepalive.txt) -lt 600 ]]
then
  echo 0:$(cat /var/prtg/scripts/keepalive.txt):OK
else
  echo 1:0:DOWN
fi
#################################################
Note: prtgsh.sh and keepalive.txt should be created in the /var/prtg/scritps/ folder. This is a requirement of PRTG itself (I’ll discuss this later).
Once you’ve created the prtgsh.sh script, ensure that it’s executable by using the following command:
chmod 755 prtgsh.sh
In our case, we configured the script to let us know if we’re down on the server side, by sending us keepalive messages. Below is a command to verify that the appliance is up and running:
export PGPASSWORD=root; psql plixer -c 'select extract(epoch from now())::INT - max(last_flow_ts) as keepalive from plixer.exporters;'
The output should look like this:
[root@ip-10-18-4-26 scripts]# export PGPASSWORD=root; psql plixer -c 'select extract(epoch from now())::INT - max(last_flow_ts) as keepalive from plixer.exporters;'
  keepalive
 -----------
         59
 (1 row)
 [root@ip-10-18-4-26 scripts]# export PGPASSWORD=root; psql plixer -c 'select extract(epoch from now())::INT - max(last_flow_ts) as keepalive from plixer.exporters;'
  keepalive
 -----------
         60
 (1 row)
 [root@ip-10-18-4-26 scripts]# export PGPASSWORD=root; psql plixer -c 'select extract(epoch from now())::INT - max(last_flow_ts) as keepalive from plixer.exporters;'
  keepalive
 -----------
          1
 (1 row)
After 60 seconds, the cycle should start from the beginning, which tells us that the value under keepalive.txt is still valid and Scrutinizer is not down. Now it’s time to go to PRTG and start building our script-based sensor.
- Our target system type would be Linux/macOS and the technology used is SSH
- Based on a given filter, among matching Sensor Types, we’ll select SSH Script

Here is the important notice mentioned earlier, where PRTG specifies the rules that need to be followed in order to accomplish our goal: “For security reasons, you must store your script file in the /var/prtg/scripts directory on the target system. Make sure that the scripts has executable rights. If the script is not available or was deleted from the directory, you get the error message Script not found (237).”
Below is the information regarding configuration of the sensor:
- Under Basic Sensor Settings, name a sensor (in our case, its “Actively collecting netflow”)
- Parent tag: saas
- Tags: sshscript
- Under Sensor Settings, ensure to select script name (prtgsh.sh in our case)
- Character encoding: UTF-8 (default)
- Under SSH Specific, we set Connection Timeout equal to 60 seconds and Shell Timeout to 10 seconds. All the rest of the settings remain default.
Pretty straightforward, isn’t it?
In our instance, we’ll add a new sensor by naming it “Actively collecting netflow” and wait for PRTG get this information from the appliance where our script is running. Once it’s been found, we should start receiving information from our appliance as shown in the diagram below:
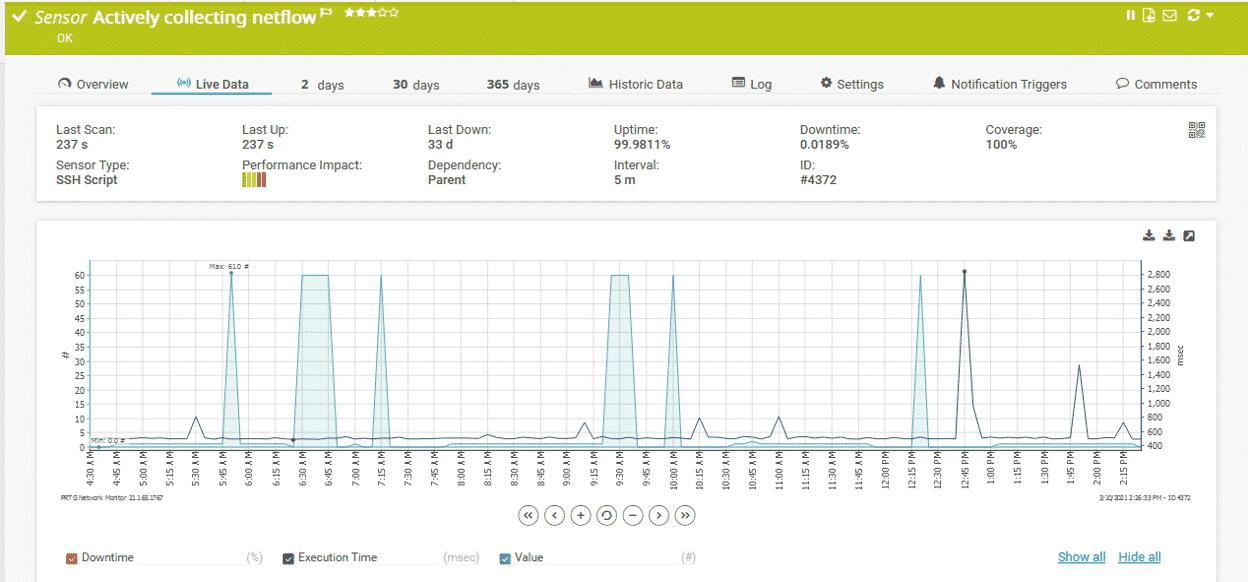
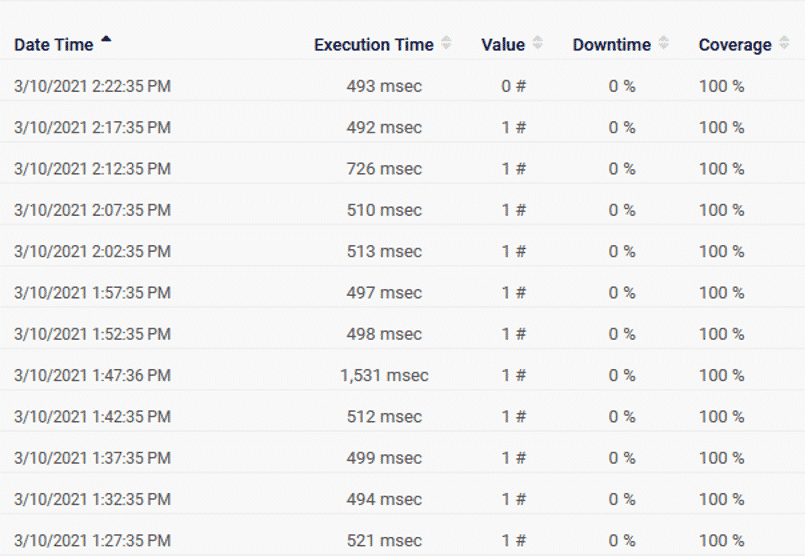
In the diagram above, we can see that the highest peak reached by PRTG is value 60, which means it’s reached 60 and circled back again. We can also see Value 1 being received every 5 minutes. We got our custom sensor set up and working as expected.
Conclusion
The main purpose of this blog was to highlight the beauty of a result using CentOS, PRTG, and of course Scrutinizer, which is my favorite tool so far.