One of the most common support requests that I get each day is, “how can I create network monitoring reports?” This article will focus on that exact question, showing you how to view NetFlow data and get to the information you want. So, let’s get started.
Getting Started with Network Monitoring Reports

The first place to head to, when creating network monitoring reports, is the Status tab. This will show you all the interfaces, sorted by highest utilization, and is a great place to start when generating reports.
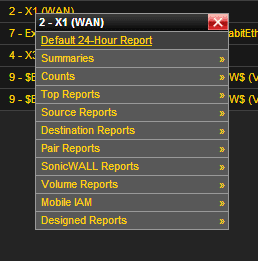
From the Status tab we will choose an interface, from the interface column, that we want to get information from. Select the interface and choose Default 24-Hour Report (you may need to select a template depending on your device; in this case, choose All Templates > Default 24-Hour Report).
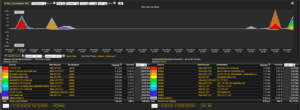
Having selected Default 24-Hour Report you will now be in a Pair >> Conversation WKP (Well-Known Port) report showing data for the last 24 hours. This data is all the data from the last 24 hours on the interface you have chosen (in my example, it is the WAN traffic).
Narrowing Down Your Data
So now that you have a basic report generated for the interface you want (a simply last 24 hours of all traffic), I am sure you are asking, “how can I get even more granular with this information?” Let’s take a look and see what we can do.
The first section I want to show you is the filtering options. You will find the filters on the left side of the screen above the “Current Filter”.
When you select this option you will see the many options you have to narrow down this information.
By selecting a filter you can narrow your current filter to either include or exclude data based on the information provided. I will choose IP Host to filter on my internal IP address (if I wanted to exclude my IP I would click on the green box with a plus (+) sign turning it red with a minus (-) sign) and then select the blue plus button to add the filter.
Now, only my traffic is being displayed in the results.
If you want to go even more granular you can drag your mouse over an area with spikes in the graph, and the time frame will update from “last 24 hours” to the time where the spike occurred, providing you with even more information concerning the spike.
Another way to get even more granular details is to change the interval (the default for a 24 hour report is 30 minutes, but this can be changed to as low as 1 minute). The one minute report will provide you with all the data in your specified time frame, but may take considerable amount of time to load depending on your server’s specifications.
Saving your reports
Now that you know how to start a report and filter the data, let’s save it for future use. To save your report all you need to do is name the report and select the red flashing disk, in the left side of the screen.
Whenever you need the report again, select Saved Reports from the bottom left of the page and select your report.
So there you have it, that is how you can create network monitoring reports that can be retrieved at a later time.
If you have any questions, though, don’t forget to contact support; we are here to help.
Sign up for Advanced NetFlow Training™ coming to a city near you!


