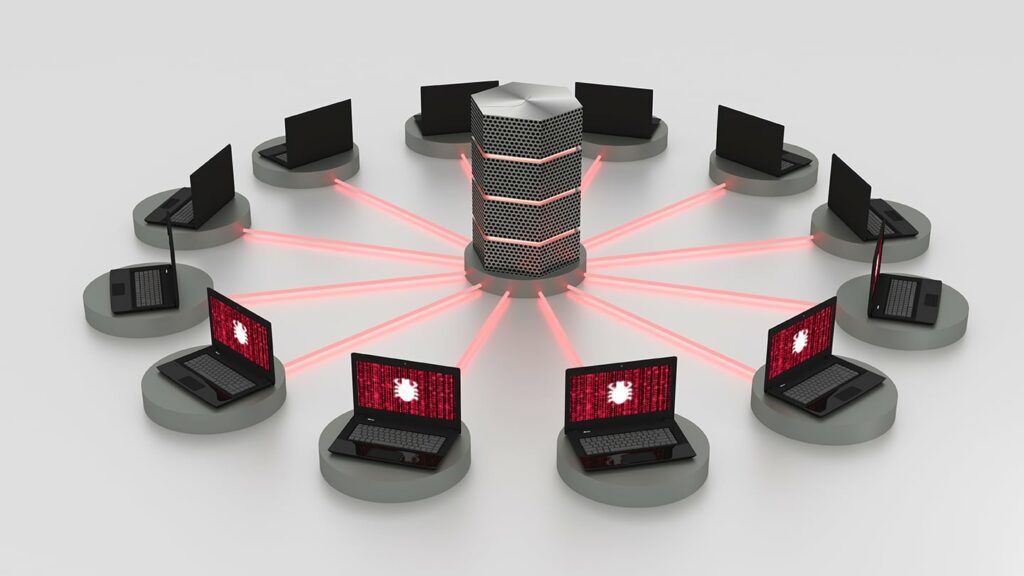
As more and more devices are added to the internet, a larger swath of insecurity comes with them. Botnets and compromised devices are the main sources of headache for attacks on infrastructure, with Distributed Denial of Services attacks becoming a major tool for the bad actors to break systems or cover their tracks during an operation. Plixer Scrutinizer provides a method for alarming on these attacks in real time.
What are DDoS and DRDoS attacks?
DDoS stands for Distributed Denial of Service, while DRDoS stands for Distributed Reflective Denial of Service. Both have similar goals while using differing methods. These attacks usually involve many compromised machines or servers all acting together to flood a target with traffic. This can be strictly to consume up all the bandwidth, or to make requests tailored to overwhelm other resources the target needs in order to function.
DDoS flow analytics tuning
Tuning your DDoS alarming will be unique to your environment. The first task is to identify those exporters that are likely to have visibility into attacks and those that we need to monitor against. In most cases these will be edge devices that sit on the internet. Firewalls, load balancers, and routers are the first devices that come to mind, but depending on your environment there could be WAN switches or network taps that can supply the data for monitoring DDoS events as well. These devices do not need to be targets for attacks (though they could be); they just need to see potential attack traffic destined for other target devices.
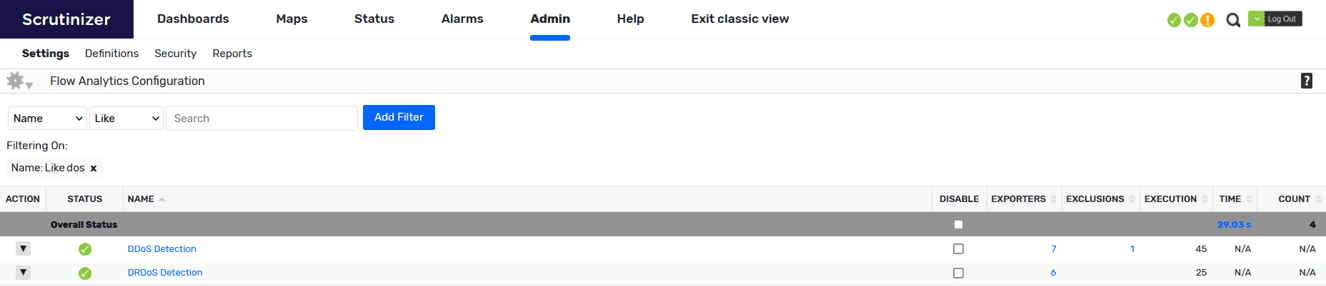
These devices we identify will need to be configured to send NetFlow data, and then we can add them to our list of exporters under the DDOS Flow Analytics alarm located under Admin > Settings > Flow Analytics Configuration:
If you hover over “DDoS Detection” you will get a concise description of how the algorithm functions which reads:
“Identifies generic Distributed Denial of Service (DDoS) attacks targeted at your protected network space. Refer to the DRDoS algorithm for detection of the more common Distributed Reflection DoS attacks. Note that DDoS algorithm may take a lot of time depending on the exporters selected. There are four settings which are used to adjust the sensitivity of the DDoS detection algorithm:”
Now let’s dig into these settings, which you can access by clicking on the “DDoS Detection” name.
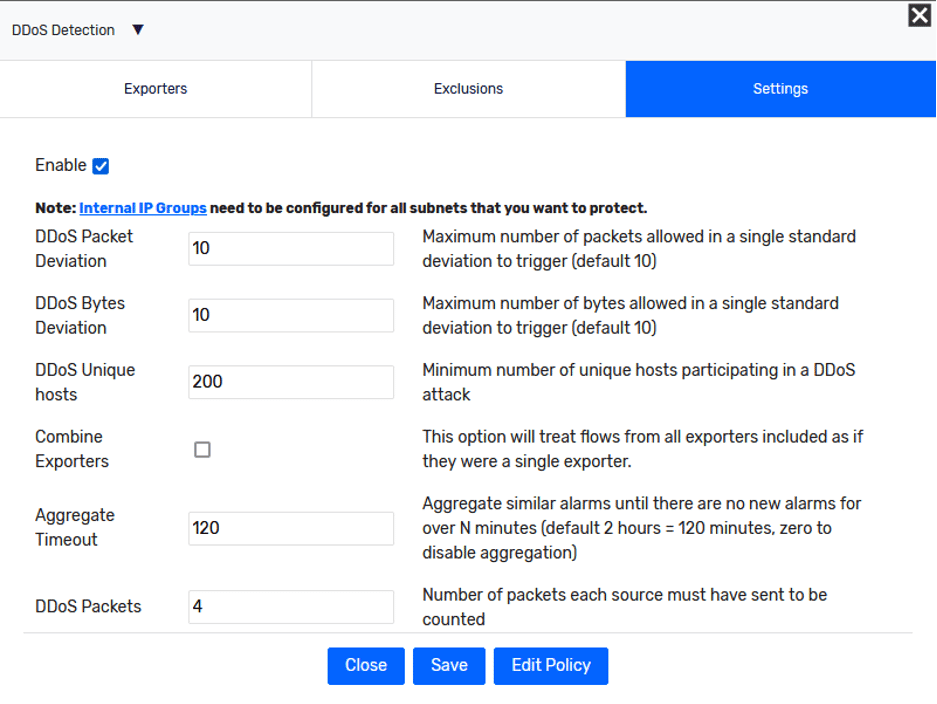
The first thing we need to do is follow the note at the top. Identify your potential targets for DDoS events and add them into an Internal IP Group so they will be protected by this algorithm. These are usually web servers, load balancers, or proxies that sit on public IP addresses you own and are normally not considered internal addresses. These can be entire subnets or single IP addresses—anything the public might be able to access. For example, if you are an ISP, these could be residential IP blocks you manage.
“DDoS Packet Deviation (10) and DDoS Bytes Deviation (10) – These settings control how similar the flows associated with the attack must be. The standard deviation of the byte count and packet counts associated with the flows must be less than this setting for DDoS attacks that are not reflection attacks. Reflection attacks ignore these settings.”
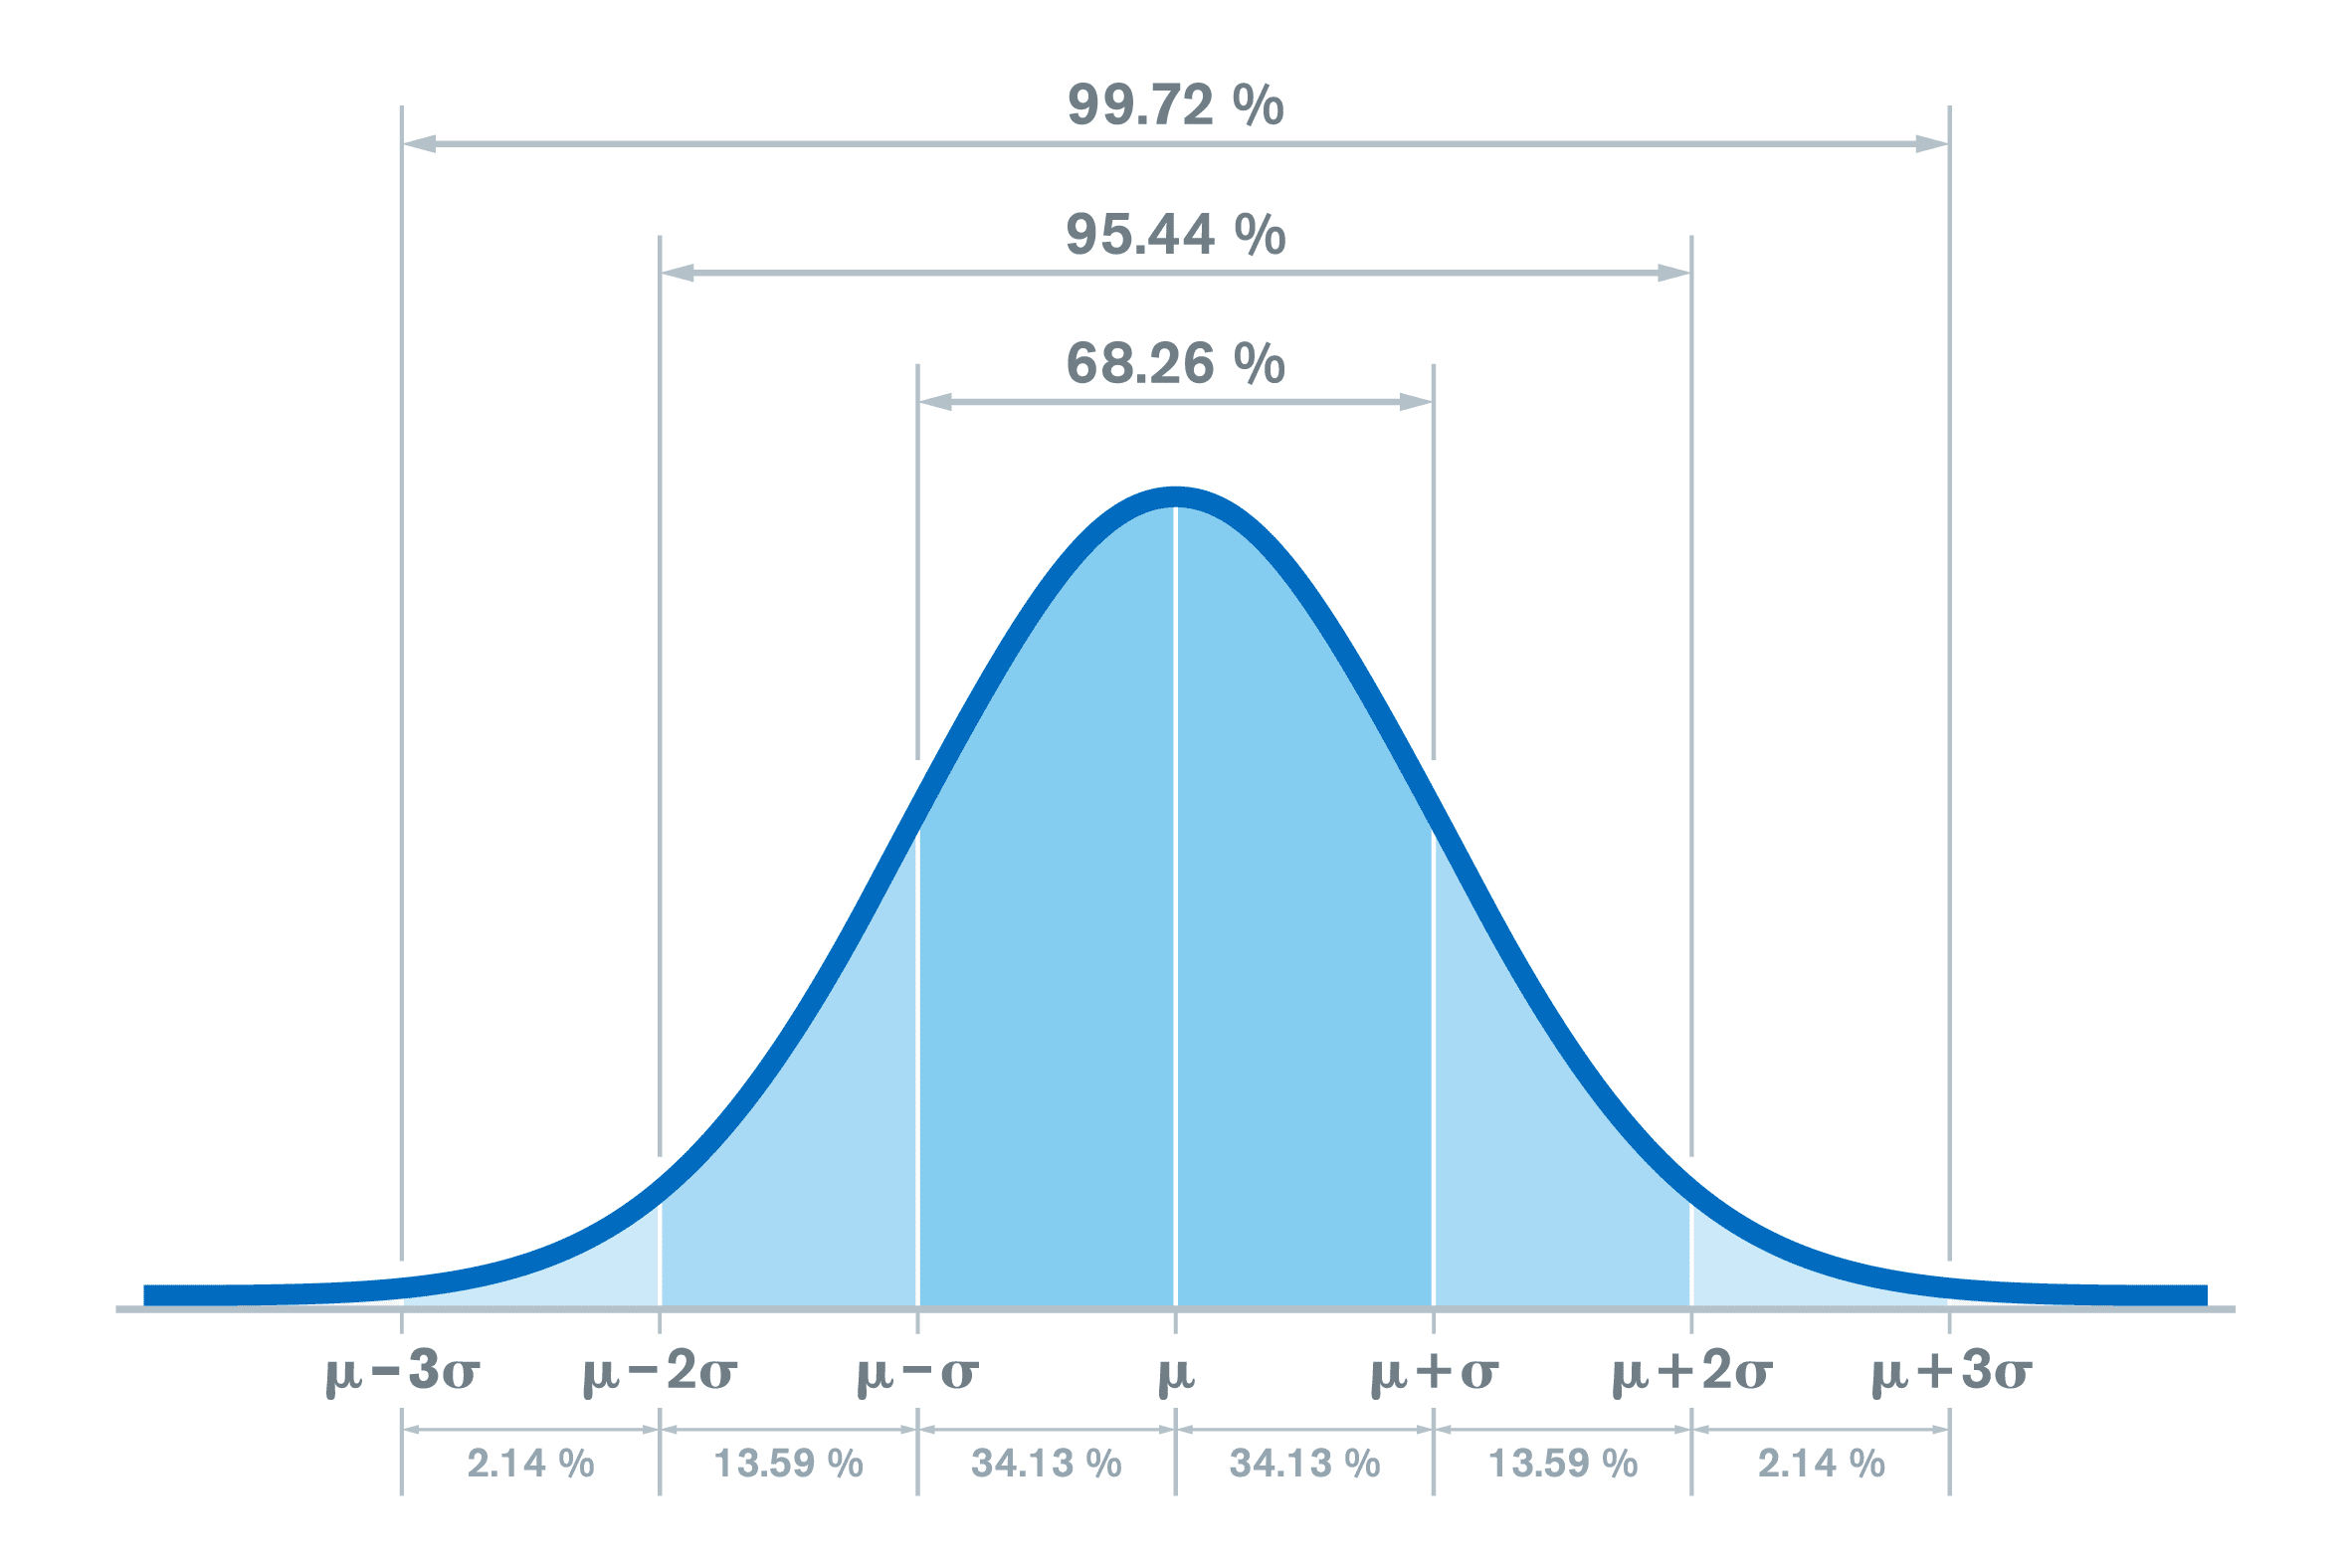
Many, including myself, have their eyes glaze over when hearing “standard deviation.” Let’s break these two settings down to provide some clarity on exactly what they measure. For the packet’s deviation setting, we are looking at the packets per flow. The smaller the value gives a tighter grouping while a larger value is looser.
For bytes deviation, we’re looking at the single host’s bytes per packet and making sure these values fall within our standard deviation setting. The smaller the value here, the tighter the grouping in byte difference, the larger the value the looser the grouping!
You can think of both through the lens of what normal traffic you would expect to be going to your target hosts. For example, if you expect usual traffic to have a low variance in byte count between each packet, then you can lower the value to trigger under tighter conditions.
The next setting is unique hosts. This is the unique number of attackers sending traffic to a target host. This is a setting you’ll want to tune to your environment since 100 hosts reaching out to a certain server may be completely normal or very low. This period of measurement will be over a single minute; when that expires, the counters are reset.
The packet count will simply be the number of packets being sent per host. An attack must meet all the settings to be considered an alarm-worthy attack and to be sent to your alarm page. The “Combine Exporters” check box will combine all these statistics gathered across your exports, as opposed to the default of breaking each exporter’s statistics out by themselves.
DRDoS flow analytics tuning
DRDoS is like the DDoS algorithm, but it focuses on the imbalance of traffic for potential targets and their attackers. Here are the settings for DRDoS:
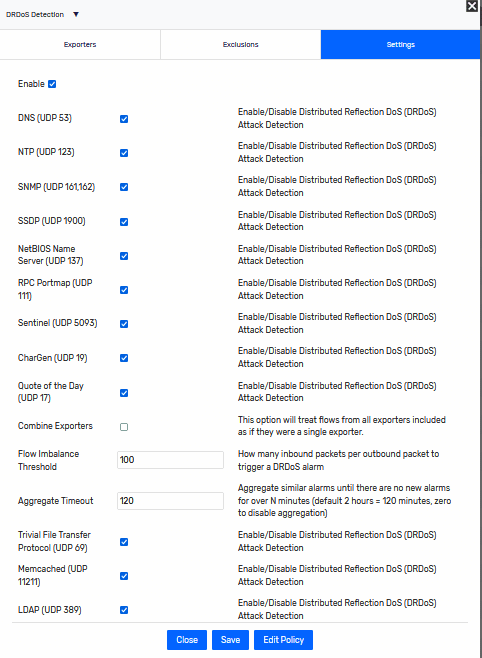
As you can see, UDP traffic is the major offender in reflective attacks. Listing the common ports in the settings allows for excluding certain types of traffic. Some environments may kick up a lot of DNS traffic or NTP traffic, creating alarms on what would be considered normal traffic. Usually, I recommend either excluding these rather than eliminating the entire protocol from the alarm. The Flow Balance setting is the ratio between a single packet sent from our target host to the potentially many from an attacker.
For both flow analytics algorithms, there is a common setting called “Aggregate Timeout.” This setting allows you to set a time for which no new alarms are generated for the same traffic in the period. This prevents getting too many alarms over time and muddying the waters when you view your alarms. Here are a couple of other blogs with information regarding DDoS detection:
If you have any questions or need some assistance in tuning your flow analytics, give support a call!