The process of setting up a new network map has changed a bit in the newest Plixer Scrutinizer v19.1.0 release. Today, I’d like to go over setting up a new network map and configuring new connections between map objects.
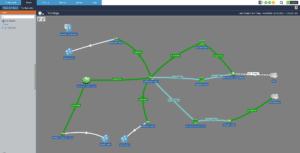
Network maps can help visualize utilization for any link with just a simple glance. Map links can display information on link saturation based on the speed of the connection or on data you defined in saved reporters.
Creating a network map
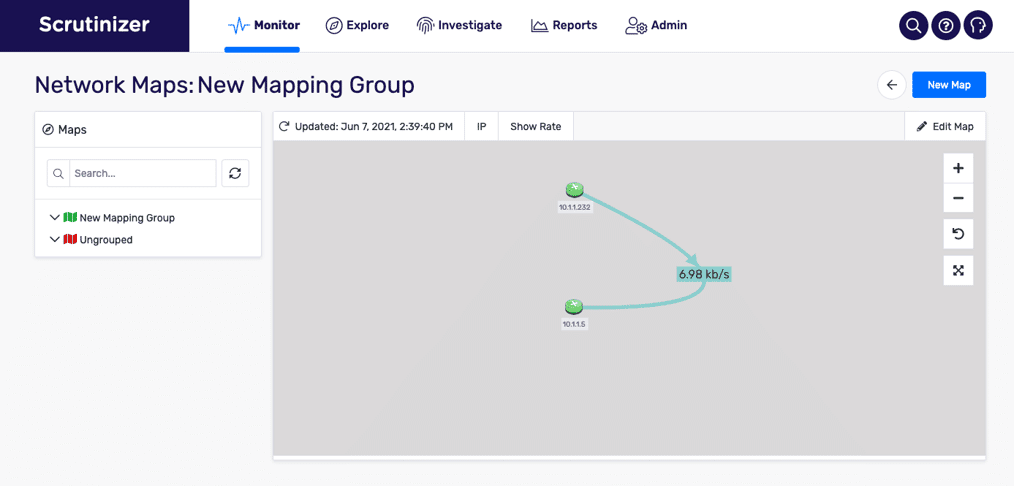
In Scrutinizer v19.1.0, you can view your network maps from the Monitor tab. When you navigate to Monitor > Network Maps for the first time, a setup wizard will guide you through creating your first network map.
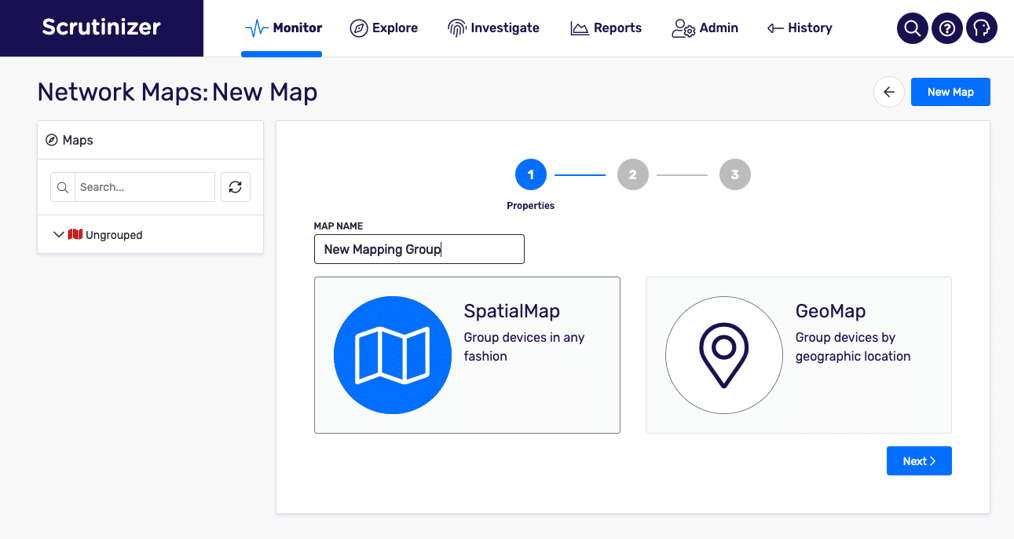
If you already have mapping groups configured, select New Map in the top left corner. On this screen you will have two options: SpatialMap and GeoMap. In this example, we will focus on SpatialMaps. Just know that the GeoMap option allows you to create maps that have objects placed at their geo-location. This can be handy when setting up maps to display data flowing between different data centers.
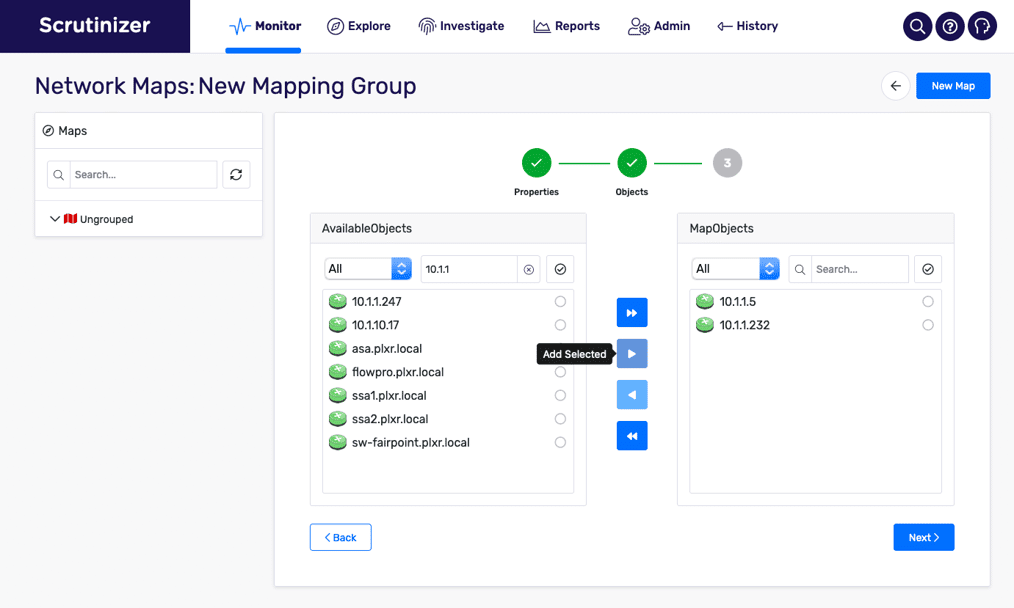
After selecting SpatialMap, the next screen will allow you to add devices to this map group. Keep in mind that creating a new map will also create a new device group with the exporters and objects you add to this map. You can see this when looking at the Explore tab.
Once you have all the devices you would like to add to the map, click Next to start setting up your map connections.
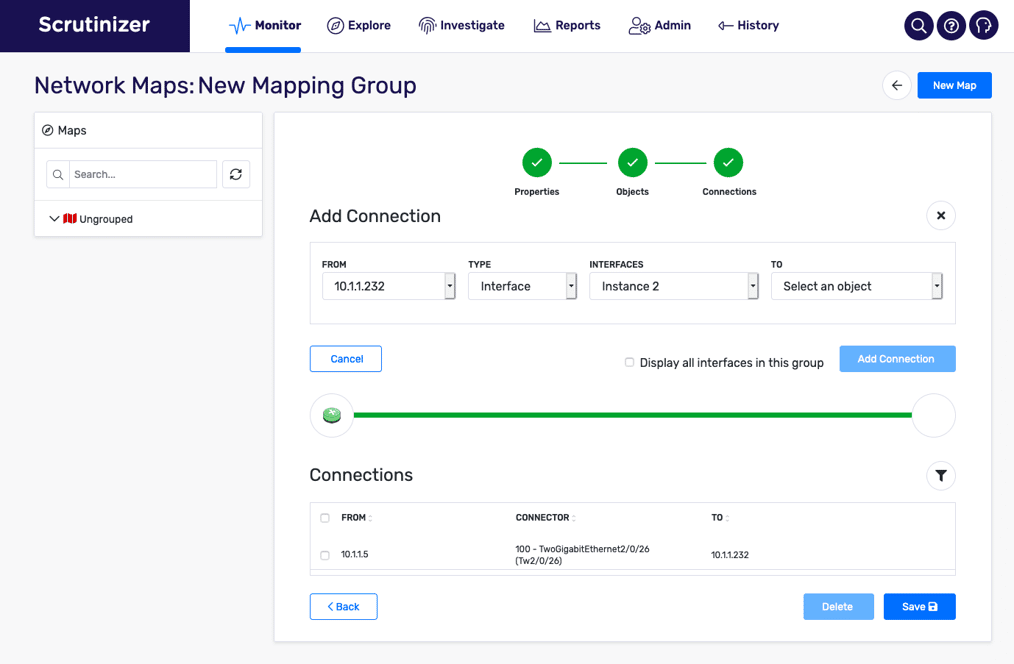
In this next screen, you can add links between each of your network objects. Select the from and to devices and the interface you want to connect with, then select Add Connection. This will show interface utilization of that interface on your map.
Once you have the interface connections you want to display on your map, select Save to start using your new map.
Now that we have a basic map created, let’s add a custom icon that will represent an application on our network.
While in Edit Map mode, we have a few options along the top of the screen. Click the plus sign to edit the objects in this map group.
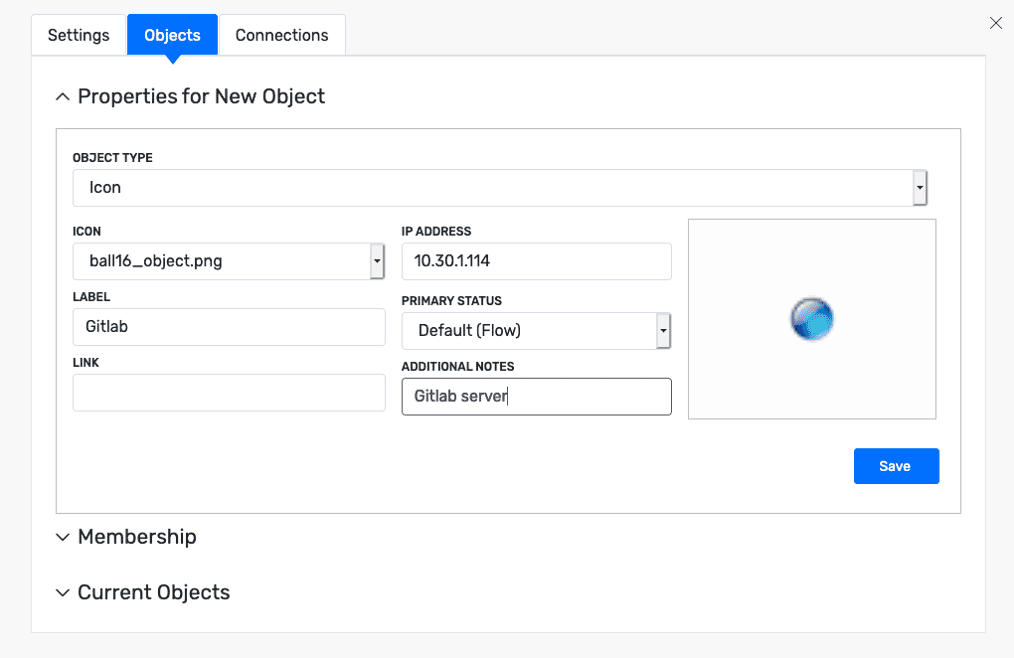
From the Current Objects section, click the plus button to add a new object. We will create a new icon and give it a label of “Gitlab” as we want to represent all the traffic currently communicating with our Gitlab server.
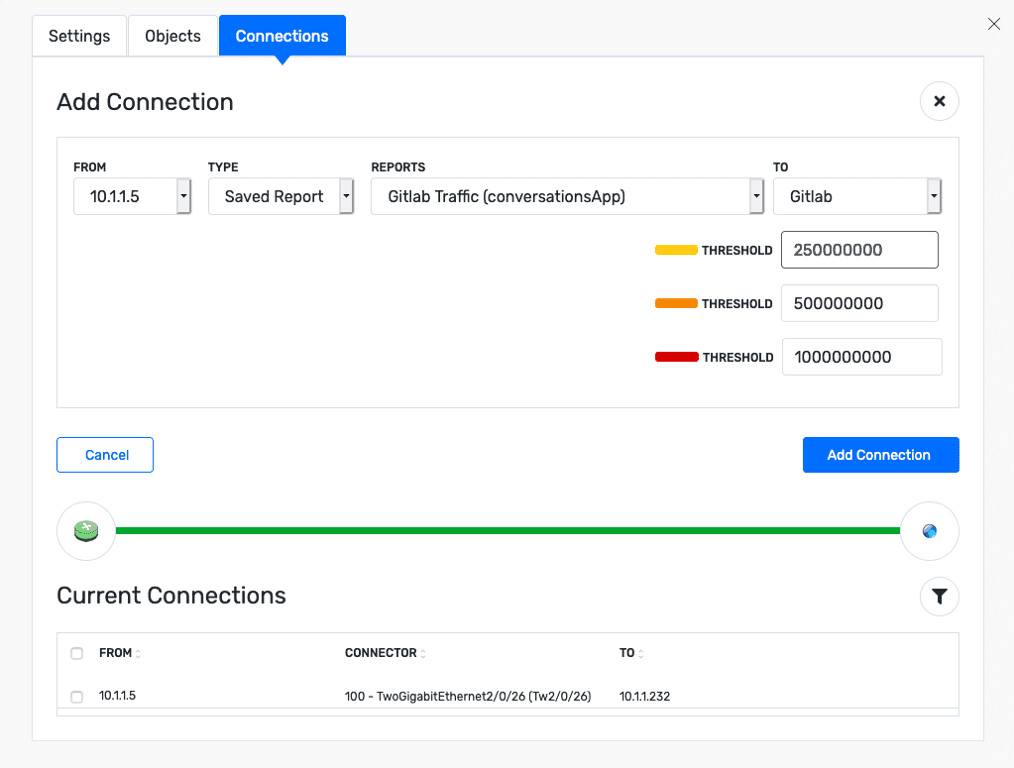
After saving that new map object, we will go to the Connections tab to link it to the switch it is physically connected to with a saved report. This will create the link on the map that is based on the traffic in the Gitlab Traffic saved report.
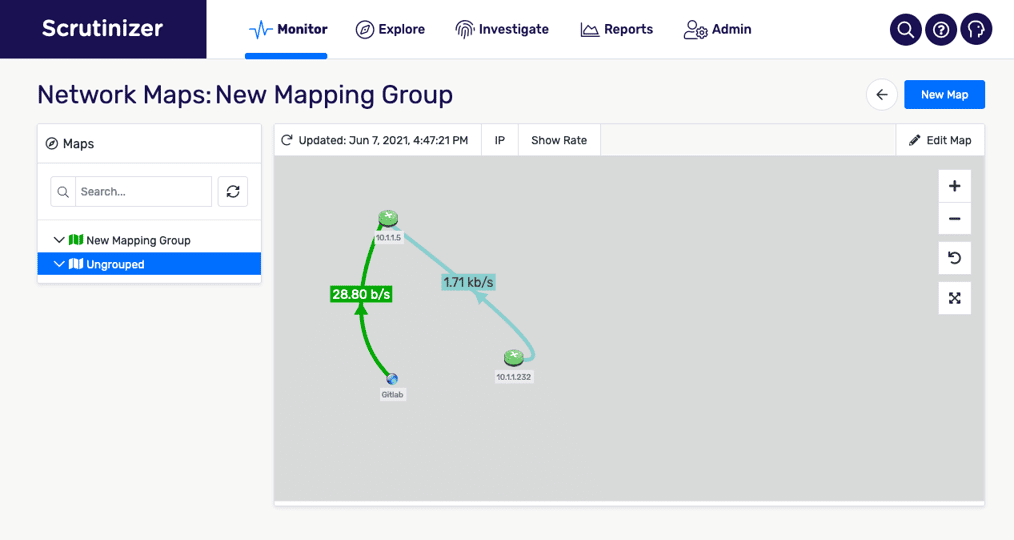
Now, when viewing this map, I can click on the link between the 10.1.1.5 and Gitlab object to run the report!
Conclusion
Network maps can display all types of information. It’s just a matter of configuring your maps to display the data you want to get access to. Just about any report in the Scrutinizer product can be used to represent a link in a Network Map. If you would like to schedule some time to see how you can benefit from this custom network mapping workflow, reach out to support today!